
App load time is crucial – it’s the time your app takes to become usable after opening. Users care about when they can interact, not just when it looks ready. Slow load times frustrate users, and 53% abandon mobile sites that take over 3 seconds to load. Measuring this accurately helps improve performance and retain users.
Here’s how to measure app load time effectively:
- Web Apps: Focus on metrics like Largest Contentful Paint (LCP), First Contentful Paint (FCP), and Interaction to Next Paint (INP). Tools like Google Lighthouse and WebPageTest help simulate and analyze performance.
- Mobile Apps: Measure Cold Start, Warm Start, and Hot Start times. Use tools like Android Studio Profiler, Xcode Instruments, and Firebase Performance Monitoring for real-time and user-based insights.
- Key Metrics: For web, aim for LCP ≤ 2.5s, FCP ≤ 1.8s (mobile), and INP ≤ 200ms. For mobile, Cold Start should be ≤ 5s, with Warm and Hot Starts under 2s and 1.5s, respectively.
- Testing Process: Use both lab tools (e.g., Lighthouse) and field data (e.g., Firebase) to ensure consistent results. Always test under varied conditions like slower networks or older devices.
Focus on the 75th percentile of user experiences to address the slowest interactions and improve satisfaction. Start with tools like Lighthouse for quick audits, then dive deeper with WebPageTest or Firebase for detailed insights.
“In our experience, load times measured on real mobile networks told a very different story than desktop or lab tests. Accurate measurement only works when you test under real conditions.” David Hall, CEO AppInstitute
THIS Is How You Measure the Performance of Your Android App

Key Metrics to Measure App Load Time
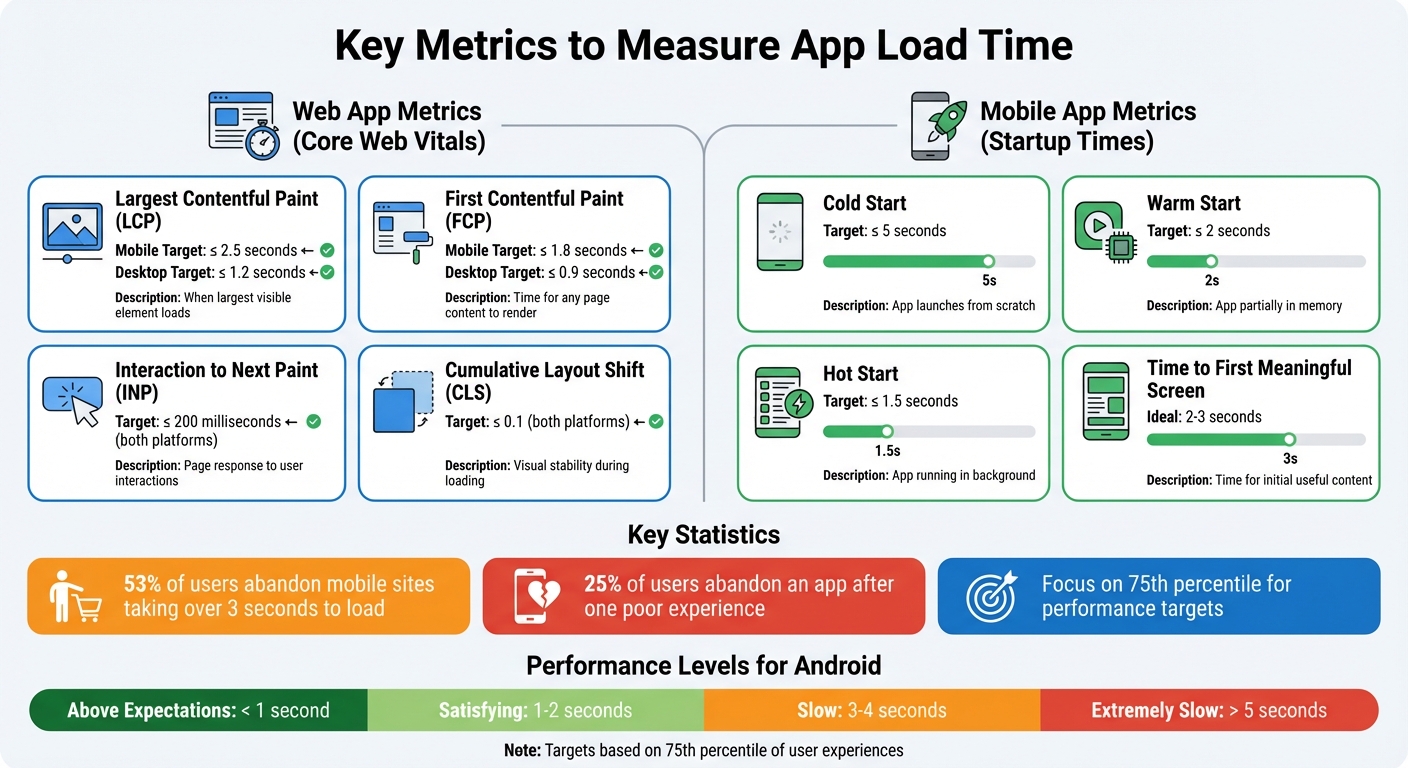
Web and Mobile App Load Time Performance Metrics and Targets
Understanding the right metrics for app load time is crucial for both web and mobile platforms. Here’s a breakdown of the key measurements you need to know.
Web App Metrics
When it comes to web apps, Core Web Vitals are the go-to benchmarks for performance. Let’s dive into the major ones:
- Largest Contentful Paint (LCP): This tracks when the largest visible element on a page loads. To meet user expectations, it should occur within 2.5 seconds.
- First Contentful Paint (FCP): This measures the time it takes for any part of the page to render. The target? 1.8 seconds on mobile and 0.9 seconds on desktop.
- Interaction to Next Paint (INP): Replacing First Input Delay, INP evaluates how quickly a page responds to user interactions. A good INP score is 200 milliseconds or less.
- Cumulative Layout Shift (CLS): This ensures visual elements stay stable during loading. The goal is a score of 0.1 or less.
Additionally, the Navigation Timing API provides deeper insights by marking milestones like domInteractive and domContentLoaded, which complement the Core Web Vitals.
Mobile App Metrics
Mobile app performance is measured differently, focusing on startup times:
- Cold Start: The app launches from scratch and should load within 5 seconds.
- Warm Start: The app, partially loaded in memory, should take 2 seconds or less.
- Hot Start: Already running in the background, the app should open in about 1.5 seconds.
Another important metric is Time to First Meaningful Screen, which measures the time from the user’s initial tap to when the main features are usable. Ideally, apps should fully load in 2-3 seconds.
“When a 5-minute task takes 45 minutes, it’s not engagement – it’s frustration.”
- Aakash Gupta
With 25% of users abandoning an app after a poor first experience, these numbers directly influence user retention and satisfaction.
“We’ve seen that shaving even half a second off load time noticeably improved engagement. First impressions happen instantly and if the app hesitates, users hesitate too.” Ian Naylor, Founder AppInstitute
Setting Load Time Targets
To ensure a smooth experience for most users, performance targets should focus on the 75th percentile of page loads. This captures scenarios faced by users on slower networks or older devices.
“The 75th percentile is selected so that developers can understand the most frustrating user experiences on their site.”
Device type plays a big role here. Mobile devices, often limited by weaker hardware and less stable networks, have more lenient targets compared to desktops. For example:
- Desktop LCP: 1.2 seconds
- Mobile LCP: 2.5 seconds
Globally, the top-performing sites achieve an FCP of about 1.2 seconds.
| Metric | Mobile Target | Desktop Target |
|---|---|---|
| LCP (Loading) | ≤ 2.5 seconds | ≤ 1.2 seconds |
| FCP (First Paint) | ≤ 1.8 seconds | ≤ 0.9 seconds |
| INP (Interactivity) | ≤ 200 milliseconds | ≤ 200 milliseconds |
| CLS (Stability) | ≤ 0.1 | ≤ 0.1 |
For a page to pass the Core Web Vitals assessment, the 75th percentile of all three metrics (LCP, CLS, INP) must hit the “Good” range. Start by prioritizing landing pages, where the “cold load” challenge is most apparent due to unprimed browser caches. Use Real User Monitoring (RUM) over a rolling 28-day period to gather field data and account for real-world variations.
Setting accurate targets like these lays the groundwork for effective testing, which will be explored in the next sections.
Measuring Web App Load Time
To evaluate your web app’s performance, tools like Google Lighthouse and WebPageTest are indispensable. Here’s how to use them effectively.
Using Google Lighthouse
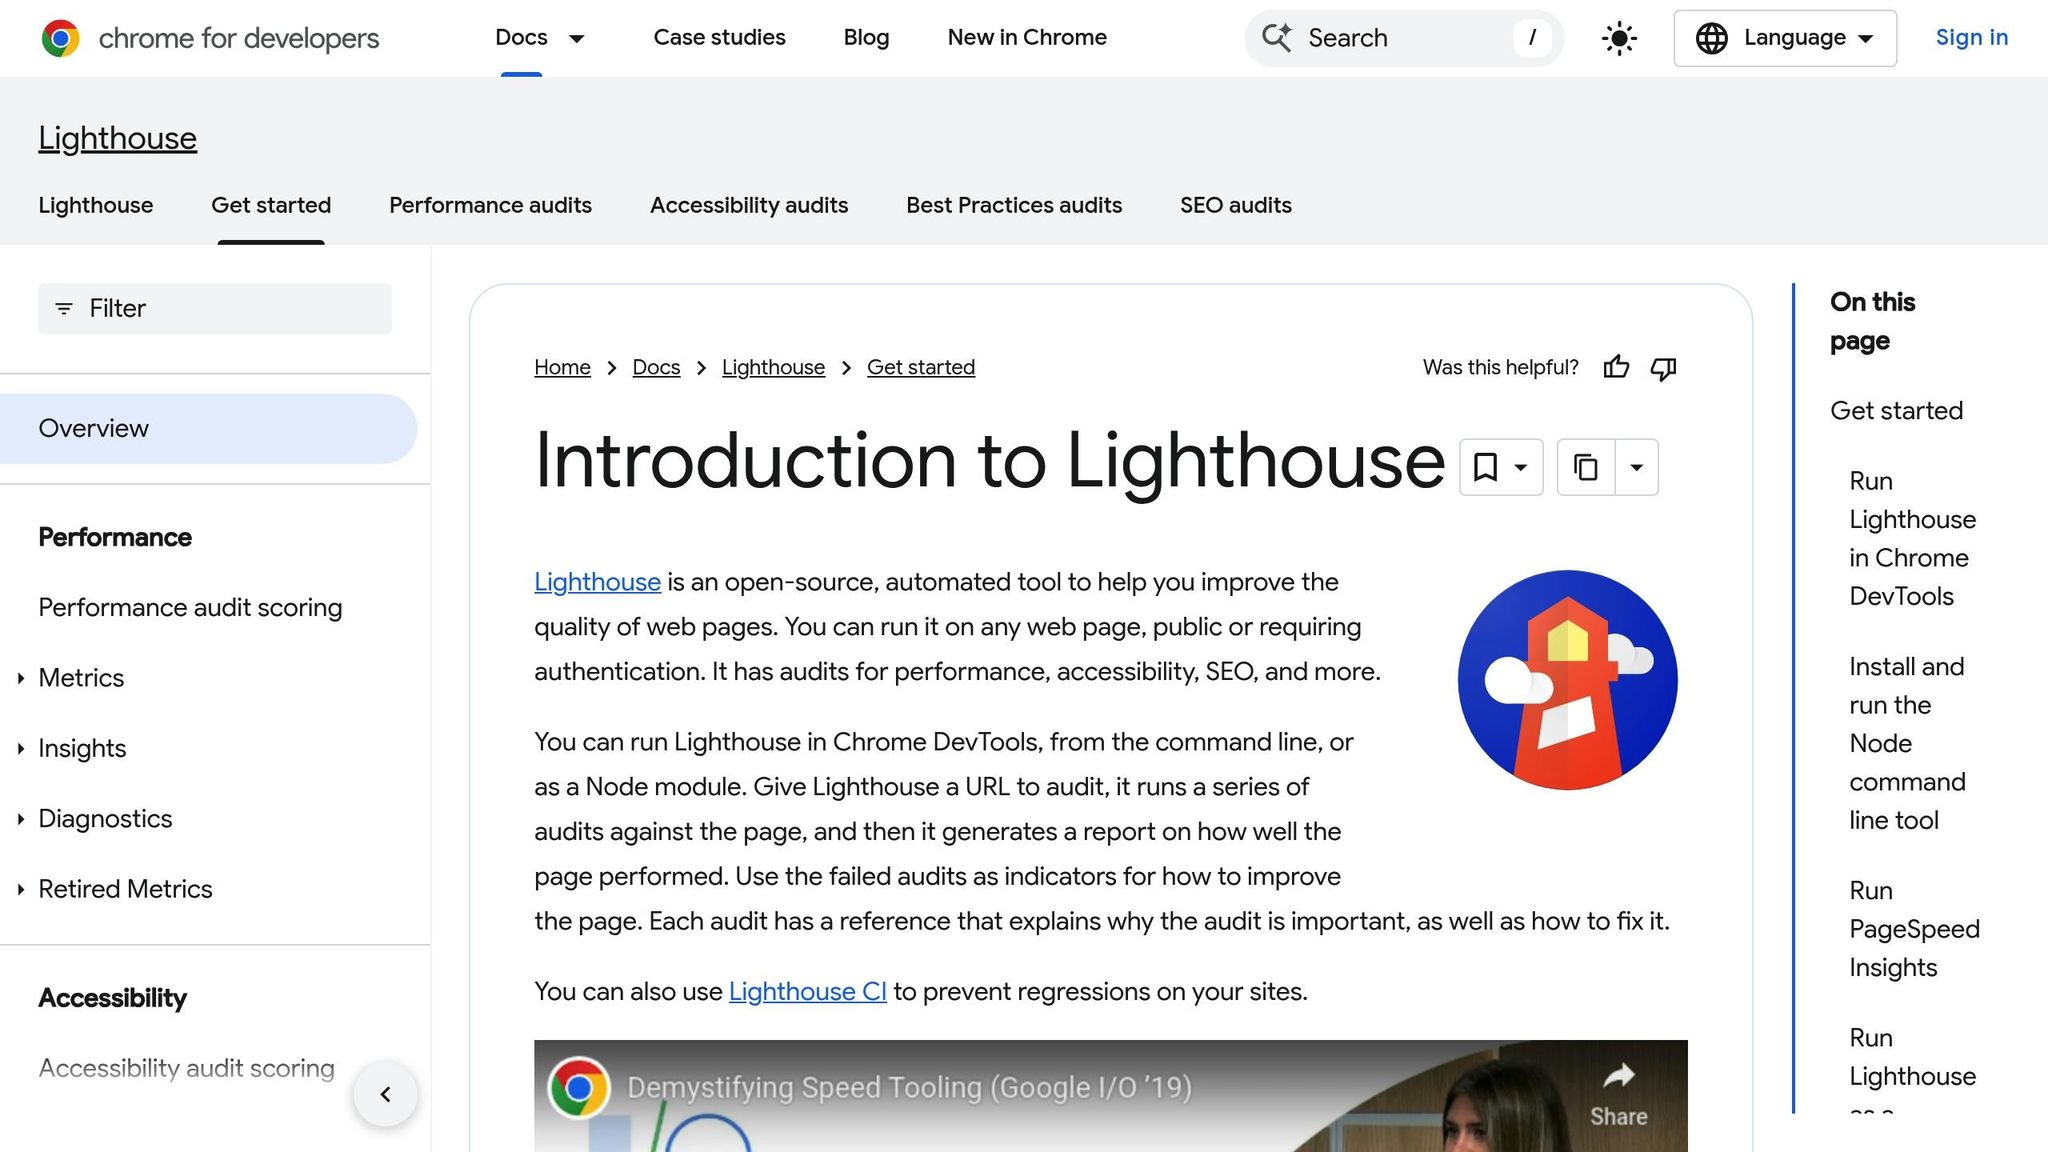
Google Lighthouse is integrated directly into Chrome, making it convenient for quick performance checks. Start by opening Chrome, navigating to your web app, and pressing F12 (or Cmd+Option+I on Mac) to launch DevTools. Then, switch to the Lighthouse tab.
For accurate results, use an incognito window to avoid interference from browser extensions. Choose Navigation mode to simulate a fresh page load, select Mobile as the device type, and enable the Performance category. The mobile setting mimics slower CPUs and smaller viewports, providing insights into how your app performs under typical mobile conditions.
Enable Clear Storage to simulate a first-time user experience. Set throttling to Simulated Fast 3G with a 4x CPU slowdown, which balances realistic mobile conditions with reasonable test durations. Once everything is configured, click Analyze page load and wait for the report, which usually takes 30–60 seconds to generate.
“Lighthouse is a lab-based tool that runs tests with simulated throttling in a simulated desktop or mobile environment… helpful when trying to diagnose performance problems.”
- Barry Pollard, Web Performance Advocate, Google
The Lighthouse report gives you a performance score (ranging from 0 to 100) and highlights key metrics. Scores are color-coded: green (90–100), orange (50–89), and red (0–49). The Opportunities section suggests specific fixes to improve load times, while Diagnostics provides additional technical recommendations. Reports can be exported as JSON files or shared via GitHub Gists for collaboration.
Keep in mind that Lighthouse uses simulated throttling by default, which approximates mobile performance using a desktop trace. To test under real-world conditions, switch to DevTools throttling. You can also explore the Field Data section for insights from the Chrome UX Report, which reflects data from actual users.
For more advanced testing and multi-step scenarios, WebPageTest offers deeper customization.
Using WebPageTest
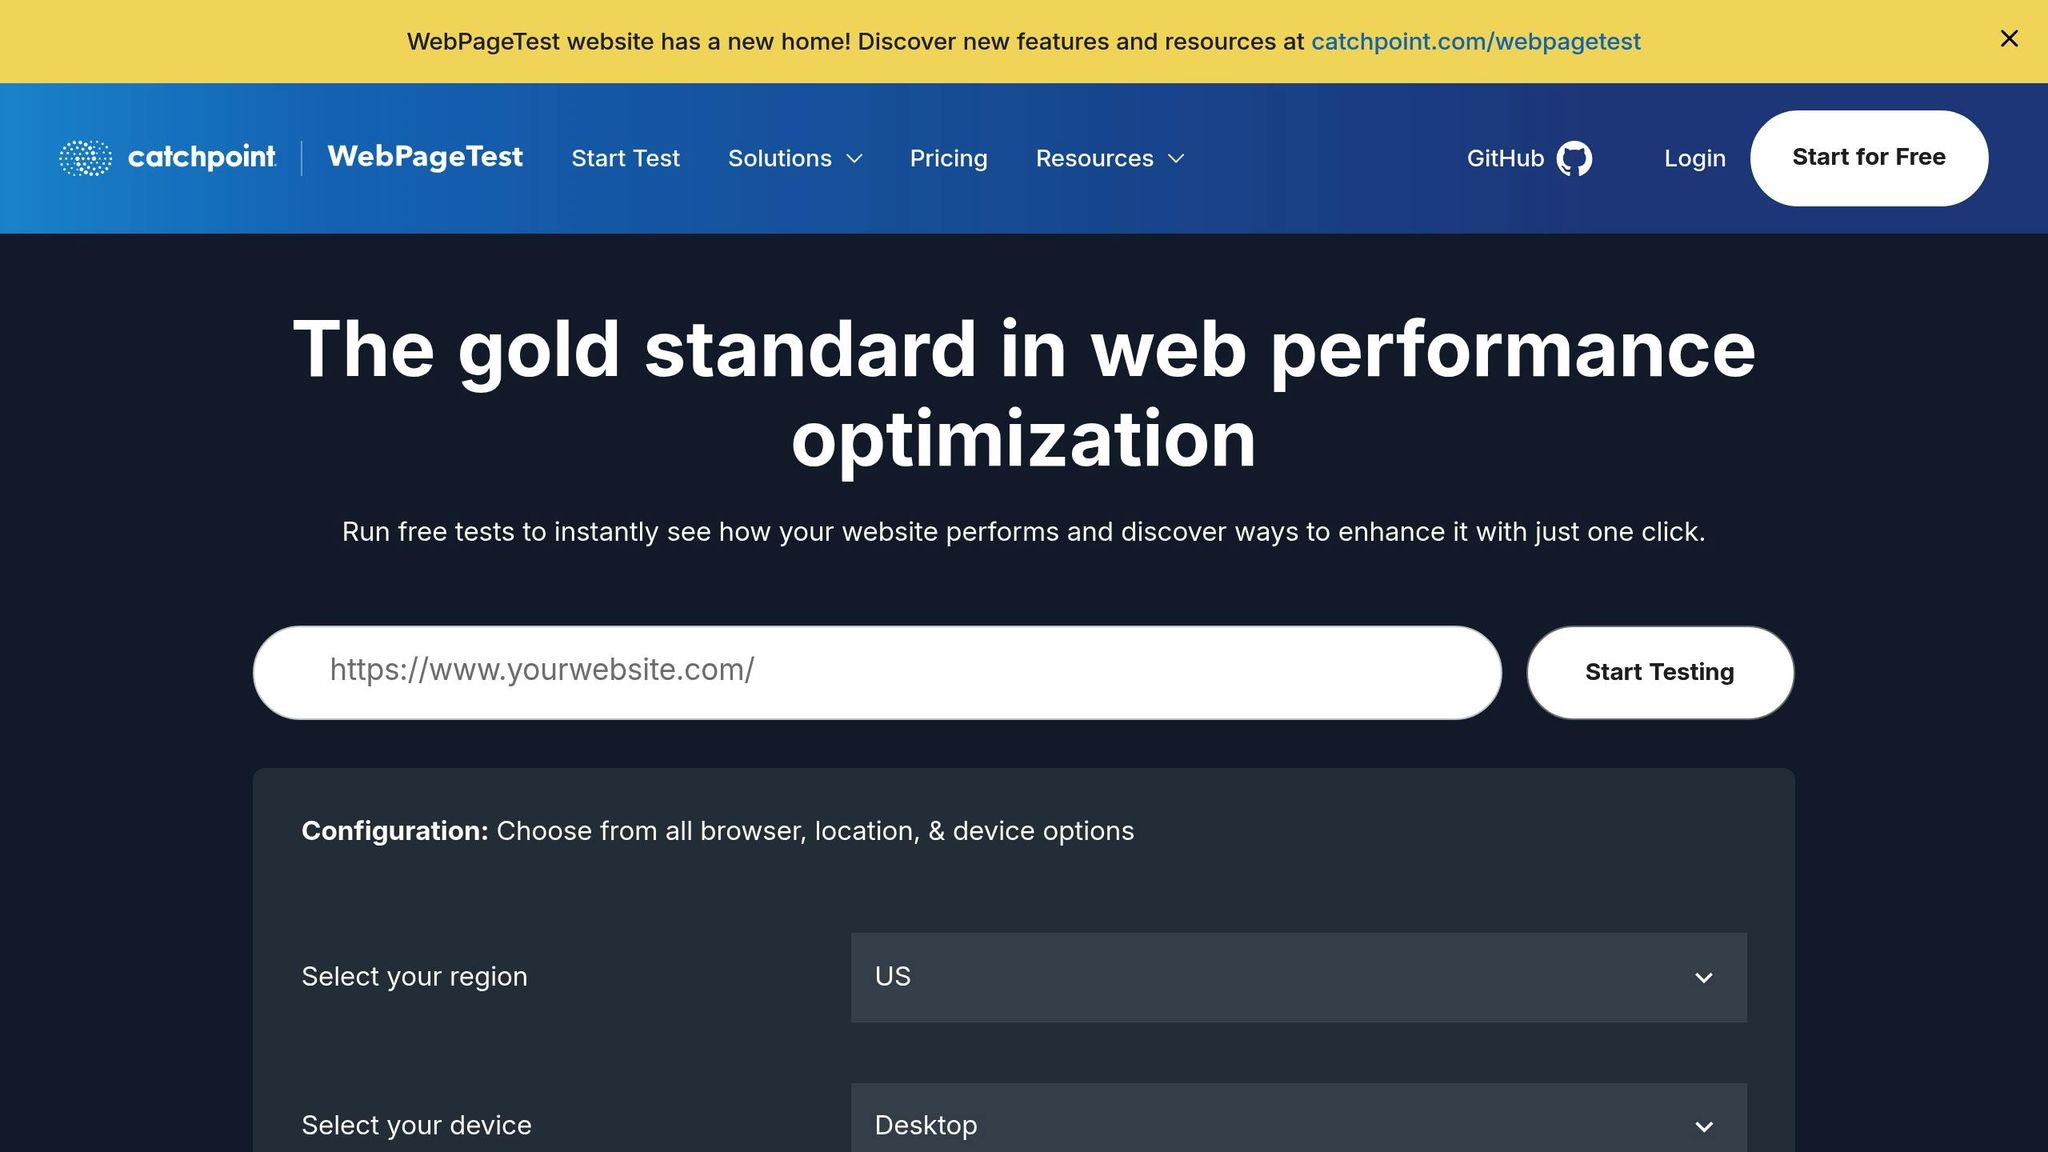
WebPageTest is a powerful tool for detailed performance analysis and offers more configuration options than Lighthouse. To get started, visit the WebPageTest site, enter your web app’s URL, and choose a test location. For U.S.-based tests, Dulles, VA is a commonly used option.
In the Advanced Configuration settings, you can fine-tune variables like device profiles, screen resolutions, and network speeds (e.g., Cable, 3G, or 4G). This helps you simulate how your app performs under a variety of real-world conditions. For mobile testing, WebPageTest emulates mobile devices with CPU throttling and other constraints.
If you’re working with a single-page application (SPA), head to the Script tab for multi-step testing. Using commands like navigate, click, and logData, you can measure performance during specific interactions. For instance, you might use logData 0 to pause data collection before a user action and logData 1 to resume it afterward, capturing only the desired transition.
“WebPageTest has long been the most advanced tool in any performance engineer’s toolbox.”
- Rich Howard, CEO, Optimal
The free tier of WebPageTest includes up to 300 tests per month and retains historical data for 13 months. Paid plans add perks like API access, priority testing during peak times, and advanced no-code optimization experiments.
Once you’ve gathered data from both tools, compare the results to identify bottlenecks and areas for improvement.
Interpreting Test Results
In Lighthouse 10, metrics like Total Blocking Time (30%), Largest Contentful Paint (25%), and Cumulative Layout Shift (25%) carry the most weight. Prioritizing these can lead to substantial performance gains.
WebPageTest provides additional insights through its Waterfall chart, which visualizes every resource loaded on your page. This chart can help you spot render-blocking scripts or stylesheets that delay content from appearing.
The Optimization page in WebPageTest assigns letter grades (A to F) for aspects like Keep-alive, Gzip compression, image optimization, and CDN usage. For example, enabling Keep-alive can reduce page load times by 40% to 50%. Pay close attention to request initiator chains in the Waterfall chart, as these can reveal delays in rendering. Also, ensure your Largest Contentful Paint element isn’t marked as low priority or lazy-loaded.
It’s worth noting that Lighthouse uses simulated throttling, while WebPageTest employs packet-level throttling. While the exact metrics may differ, the overall trends should align, offering a comprehensive view of your app’s performance.
sbb-itb-539ae66
Measuring Mobile App Load Time
When it comes to measuring load times, native mobile apps require a different approach than web apps. While web apps often rely on browser-based tools, native apps call for platform-specific tools and strategies. Both Android and iOS offer built-in tools, and cross-platform solutions like Firebase Performance Monitoring can provide real-time insights from actual user data.
Android App Tools
For Android developers, several tools stand out for analyzing app performance and load times:
- Android Studio Profiler: This tool offers real-time insights into CPU, memory, and battery usage during app startup. To get accurate load time measurements, use the “Profile ‘app’ with low overhead” option for release builds and enable “Start profiler task from startup”. This method avoids the overhead of debug builds by using profileable apps instead of debuggable ones, ensuring results that reflect real-world performance.
- Macrobenchmark Library: Designed for automated testing, this library helps measure key interactions like app startup and UI animations. It’s best used on physical devices since emulators can’t replicate actual CPU and memory constraints.
- Perfetto: Available on Android 9 (API level 28) and above, Perfetto is a system tracing tool that identifies bottlenecks like layout inflation and resource loading. When examining startup performance, focus on two metrics: Time to Initial Display (TTID), which marks the first frame, and Time to Full Display (TTFD), which indicates when the app is fully interactive. Developers can use the
reportFullyDrawn()method to signal that all resources and views have finished loading.
Android startup performance is categorized into four levels:
- Above Expectations: Less than 1 second
- Satisfying: 1 to 2 seconds
- Slow: 3 to 4 seconds
- Extremely Slow: Over 5 seconds, which may lead to “App Not Responding” errors.
For smooth interactions, apps should render frames in under 16ms to maintain a 60 frames-per-second experience. Frames taking longer than 700ms are considered “frozen”, making the app seem unresponsive.
| Tool | Best Use Case | Key Metrics |
|---|---|---|
| Android Studio Profiler | Real-time local debugging | CPU, Memory, and Battery usage |
| Macrobenchmark | Automated local testing | Startup time, Frame timing (Jank) |
| Perfetto | Deep system-level analysis | Thread states, Binder transactions, I/O |
iOS App Tools
For iOS developers, Xcode Instruments is the go-to suite for performance analysis.
- Time Profiler pinpoints CPU bottlenecks during startup, while Activity Tracing allows for a broader analysis of app behavior over time.
- For apps already in production, Xcode Organizer provides metrics like hang and hitch data from real-world users via the App Store.
To catch issues early, enable the Thread Performance Checker during development. As with Android, testing on physical devices is crucial for accurate results.
| Tool | Primary Use Case | Data Source |
|---|---|---|
| Xcode Instruments | Local profiling to diagnose bottlenecks | Local connected device/simulator |
| Xcode Organizer | Monitoring responsiveness in production | Real-world App Store user data |
Using Firebase Performance Monitoring
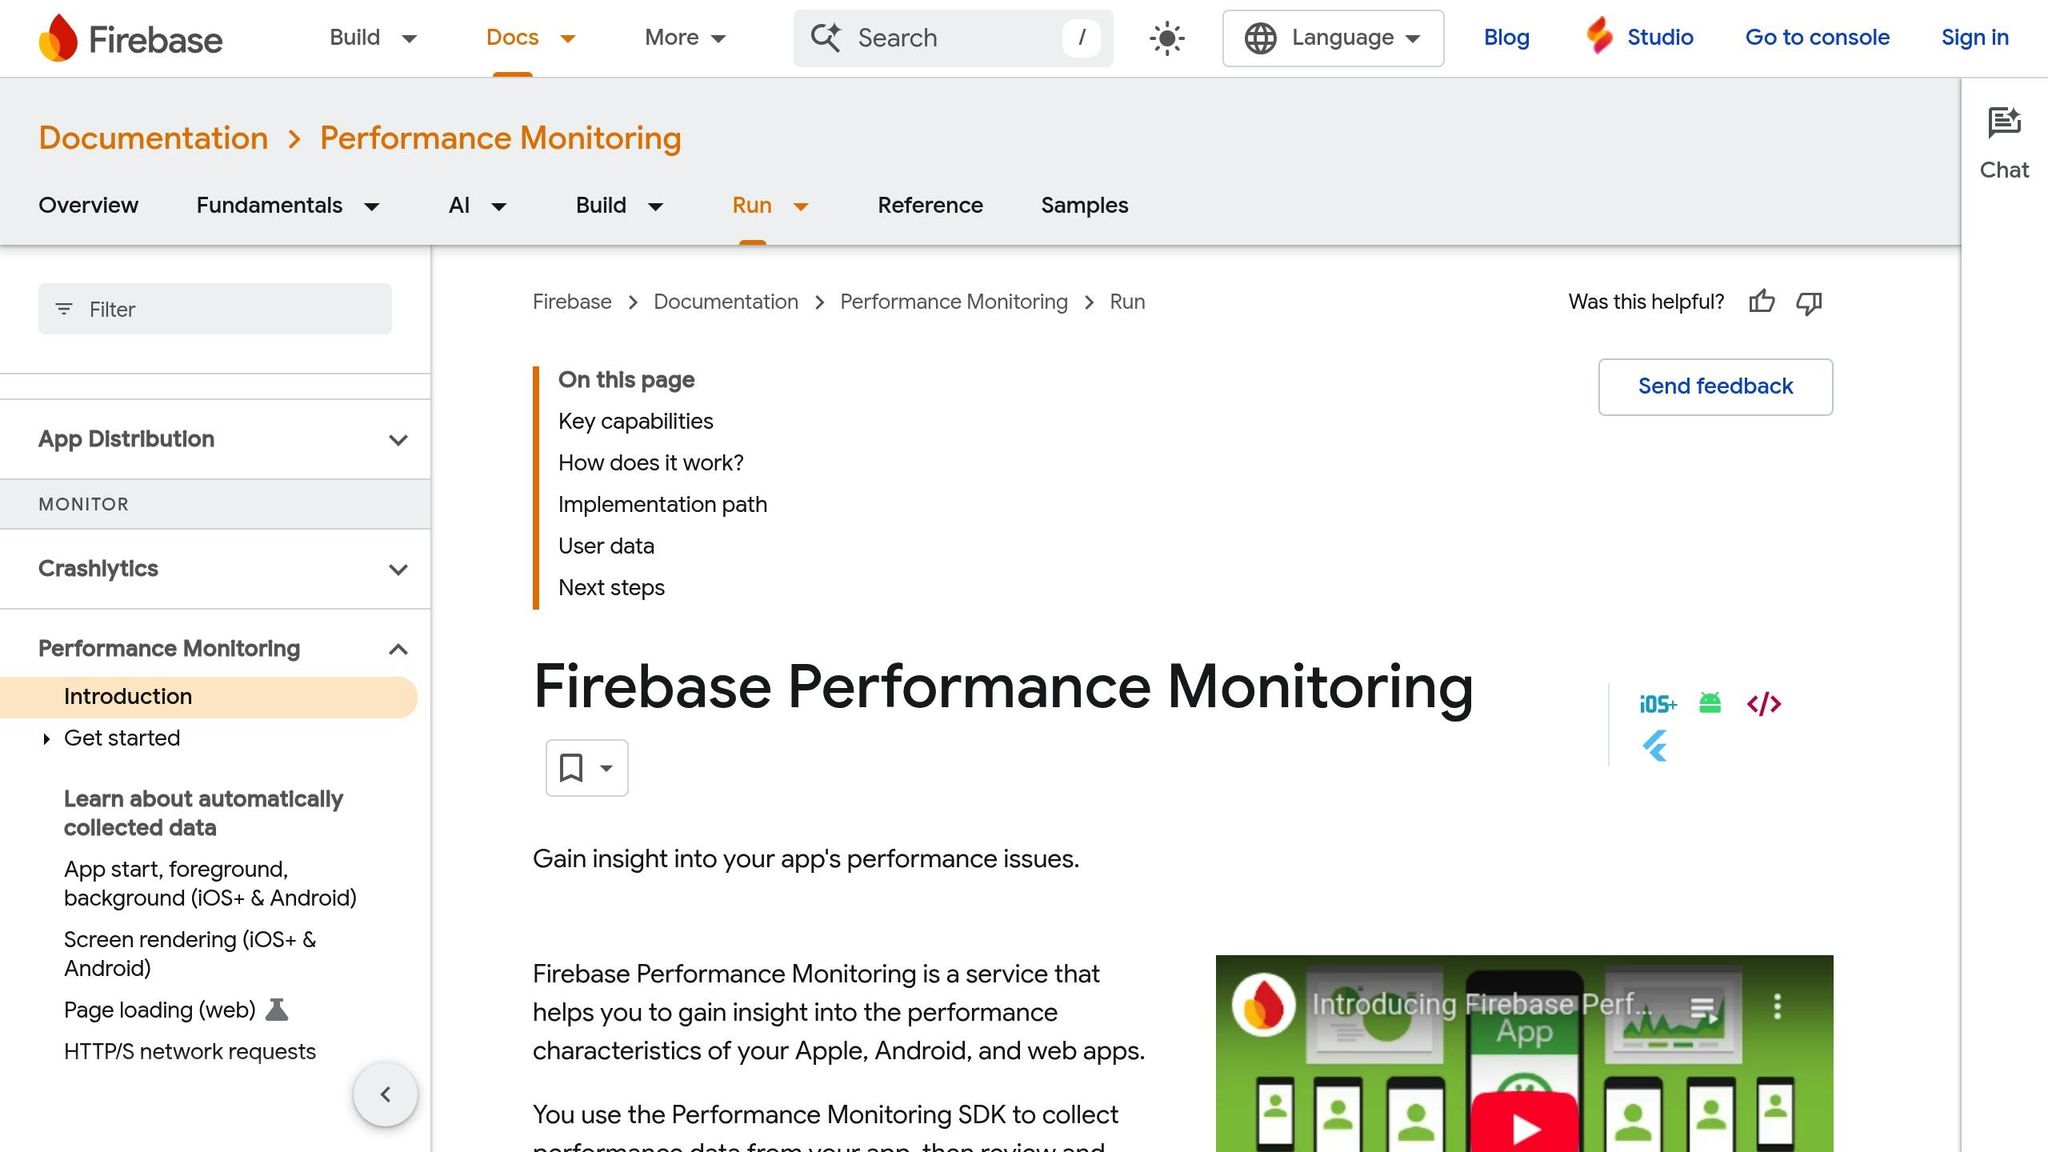
Firebase Performance Monitoring is a powerful cross-platform tool for tracking app load times on real devices and networks. It complements platform-specific tools by providing insights into how the app performs for actual users. After integrating the SDK, Firebase automatically tracks the _app_start trace, measuring the time from app launch to when it becomes responsive.
- Android Integration: Add the Firebase BoM, include the Performance Monitoring SDK, and apply the necessary Gradle plugin. This setup enables monitoring for network requests and custom traces.
- iOS Integration: Install the SDK via Swift Package Manager, add the
-ObjCflag to the “Other Linker Flags” in your build settings, and initialize Firebase in theUIApplicationDelegateusingFirebaseApp.configure().
For more specific insights, you can create custom traces using FirebasePerformance.startTrace("trace_name"). This is especially useful for measuring load times of individual fragments or activities beyond the initial launch.
Firebase reports metrics at the 90th percentile, aligning with Android Vitals standards. The Firebase console allows you to filter data by app version, device, or region, helping identify performance issues for specific user groups. You can even set up email alerts to notify your team when app start times exceed a defined threshold.
To verify that Firebase is working during development, enable debug logging:
- On Android, use
adb logcat -s FirebasePerformance. - On iOS, add the
-FIRDebugEnabledargument in the Xcode scheme.
Creating a Repeatable Testing Process
One test alone won’t give you the full picture of your app’s performance. To truly understand how your app is doing, you need a consistent testing process. This means setting a clear baseline, running identical tests repeatedly, and analyzing results under conditions that reflect real-world usage. The first step? Define testing environments that match what your users actually experience.
Defining Test Environments
Your testing environment should closely replicate the conditions your users face. For example, if most of your users are in the U.S., choose test server locations near your primary audience to reduce external latency. Testing from a server on the West Coast when most users are on the East Coast could introduce unnecessary delays that skew results.
Network conditions are equally important. Use network throttling presets to simulate LTE, 5G, or public Wi-Fi connections. This helps establish a consistent baseline. Testing under varied conditions, like slower LTE or faster 5G, ensures you’re capturing the range of real user experiences. Similarly, apply CPU throttling (e.g., a 4x or 6x slowdown) to mimic the performance of mid-range mobile devices rather than high-end machines.
For accurate first-time user data, test cold starts by clearing browser storage, disabling caching, and using Incognito or Private mode. This forces assets to load from the network rather than local storage. Tools that include a “Clear Storage” setting can automate this step.
Testing Workflow
A reliable testing workflow follows a simple cycle: evaluate, optimize, and monitor. Start by establishing a baseline, which means documenting your app’s current performance. This baseline serves as your reference point for measuring improvements and spotting regressions.
Run three to five tests and use the median result. Network fluctuations can make a single test unreliable, so multiple runs help you capture a more accurate picture.
To catch issues early, automate regression testing. Tools like Lighthouse CI can be integrated into your build and deployment process. These tools run audits on every code commit, flagging performance problems before they reach production. By setting up automated testing, you create a safety net that ensures performance stays consistent over time.
Once your workflow is in place, dig into the results to identify and address performance bottlenecks.
Analyzing Test Results
When analyzing test data, skip averages – they don’t tell the whole story. Instead, focus on percentiles like the 75th, 90th, or 95th (p75, p90, p95). These metrics highlight both typical and worst-case user experiences.
For example, Google uses the 75th percentile to determine if a site meets its “good” performance benchmark. This means that 75% of page visits need to meet the target for each metric. Jeremy Wagner, a Technical Writer at Google, explains why this approach matters:
“When you prioritize experiences at the 75th percentile or higher, you’re putting your focus where it belongs: on the slowest experiences”.
Focusing on these higher percentiles helps you understand the experience of users on slower devices or networks – those most likely to leave your app due to poor performance.
| Metric Analysis Method | When to Use | Why It Matters |
|---|---|---|
| Medians (p50) | To understand the typical user experience in lab tests | Reflects what most users encounter |
| 75th Percentile (p75) | As the primary performance target | Aligns with Google’s “good” performance standards |
| 90th/95th Percentile | For analyzing the slowest user experiences | Highlights worst-case scenarios |
Be sure to document all test conditions, including the devices, network settings, and load types used. This makes it easier to reproduce tests later and compare results across different versions of your app or over time.
Conclusion
Key Takeaways
Measuring app load times accurately is an ongoing process that combines both lab and field testing. Tools like Google Lighthouse are perfect for controlled testing and debugging, while Firebase Performance Monitoring provides insights into how your app performs for real users in everyday scenarios.
Pay close attention to metrics like LCP (Largest Contentful Paint), CLS (Cumulative Layout Shift), and INP (Interaction to Next Paint) to ensure your app aligns with user expectations. Google defines “good” performance as meeting recommended thresholds for at least 75% of user visits. To truly understand where your app stands, skip average metrics and focus on the 75th percentile or higher – this approach highlights the experience of your slowest users, who are often the most likely to leave your app.
The workflow is simple: start by evaluating your app’s performance with field data, address issues using lab tools, and use automated testing (like Lighthouse CI) to monitor for regressions. This cycle ensures your app continues to perform well, even as you roll out updates or new features.
By following these practices, you can make meaningful improvements to your app’s performance and user experience.
How AppInstitute Can Help
AppInstitute provides the tools and support needed to optimize app performance effectively. Whether you’re building a Progressive Web App using the Instant plan or creating iOS and Android apps with the App Stores Premium plan, tools like Lighthouse can help you identify quick wins. For example, reducing image sizes, deferring scripts, or enabling server compression can lead to noticeable improvements.
If you need extra help, AppInstitute’s “Hire A Pro” service, included with the App Stores Premium plan at $149/month, offers professional guidance. With this service, a dedicated account manager will assist you in setting up performance budgets, automating testing workflows, and tackling specific bottlenecks uncovered during testing. These targeted optimizations can significantly enhance user satisfaction and retention.
FAQs
What are the best tools to accurately measure app load time for mobile and web platforms?
To accurately assess app load time, you can rely on tools like Google Lighthouse – available through Chrome DevTools or the Command Line Interface – and WebPageTest for evaluating web and Progressive Web App (PWA) performance. For native mobile apps, Android Profiler is a go-to option for tracking startup performance and spotting any delays.
These tools offer in-depth metrics on load times, making it easier to identify bottlenecks and improve the overall user experience. Regularly using them helps ensure your app performs seamlessly across different devices and platforms.
How can I analyze and improve my app’s load time using performance testing tools?
Performance testing tools like Lighthouse and WebPageTest are essential for understanding your app’s load time and pinpointing areas that need improvement.
Lighthouse evaluates critical metrics such as First Contentful Paint, Largest Contentful Paint, and Total Blocking Time. It provides a performance score along with actionable recommendations. Focus on high-impact optimizations, such as minimizing render-blocking JavaScript, compressing images, or enabling caching. Once you’ve implemented these changes, run the test again to verify the results.
WebPageTest, on the other hand, offers a deeper dive with features like a waterfall chart and timing metrics, including Time to First Byte and Fully Loaded Time. It also lets you simulate tests from specific locations and devices. Use this tool to identify slow-loading resources or server bottlenecks, and address them by enabling HTTP/2 or fine-tuning server settings.
By leveraging the broader insights from Lighthouse and the detailed analysis from WebPageTest, you can systematically improve your app’s load time and ensure a seamless, fast experience for users.
Why is it important to focus on the 75th percentile when measuring app performance?
When you focus on the 75th percentile, you’re ensuring that a significant majority – about 75% of users – experience acceptable app load times. At the same time, it sheds light on the slowest 25% of users, providing a clear benchmark to uncover and address performance issues.
This method strikes a balance: it caters to most users while identifying areas that need improvement. The result? A more responsive and seamless app experience for everyone.
Related Blog Posts
- Improving App Responsiveness: Key Metrics To Track
- How To Optimize Images for No-Code Apps
- Checklist for PWA Performance Before Deployment
- How to Analyze App Test Results for Better Performance
Last Updated on January 23, 2026 by Becky Halls
0 thoughts on “How to Measure App Load Time Accurately”