
When developing cross-platform apps for iOS, Android, and PWAs, managing errors across diverse platforms is critical. Whether you’re dealing with JavaScript bugs, native app crashes, or performance issues, selecting the right error monitoring tool can save time, improve app quality, and enhance user experience. Here’s a quick breakdown of the top 7 error monitoring tools to help you make an informed decision:
- TrackJS: Focused on JavaScript and PWA errors, ideal for web-heavy apps. Starts at $39/month.
- Rollbar: Covers iOS, Android, web, and PWAs with real-time error grouping. Plans start at $15.83/month.
- Raygun: Offers crash reporting, performance insights, and supports frameworks like Flutter and Xamarin. Starts at $4/month per app.
- AppDynamics: Enterprise-level tool for full-stack monitoring with custom pricing.
- SolarWinds AppOptics: Tracks errors across mobile, cloud, and web platforms. Starts at $7.50/host/month.
- Honeycomb: Excels at debugging distributed systems with query-driven alerts. Free tier available; pricing starts at $1/million events.
- Instana: AI-powered monitoring for large-scale apps with host-based pricing.
These tools vary in features, pricing, and platform support, making it essential to align your choice with your app’s needs, team size, and budget.
Quick Comparison
| Tool | Platforms Supported | Starting Price | Key Features |
|---|---|---|---|
| TrackJS | Web, PWA | $39/month | JavaScript error tracking, browser insights |
| Rollbar | iOS, Android, Web, PWA | $15.83/month | Multi-platform support, real-time grouping |
| Raygun | iOS, Android, Web, PWA | $4/month/app | Crash reporting, real user monitoring |
| AppDynamics | iOS, Android, Web | Custom Pricing | Full-stack monitoring, enterprise focus |
| SolarWinds AppOptics | Web, Mobile, Cloud | $7.50/host | Distributed tracing, infrastructure tracking |
| Honeycomb | iOS, Android, Web | $1/million events | Query-driven debugging, high-cardinality data |
| Instana | iOS, Android, Web, PWA | Custom Pricing | AI-powered monitoring, dependency mapping |
Choosing the right tool ensures early error detection, faster fixes, and a smooth user experience across platforms.
How I Set Up Analytics & Error Monitoring for Mobile App Development
1. TrackJS
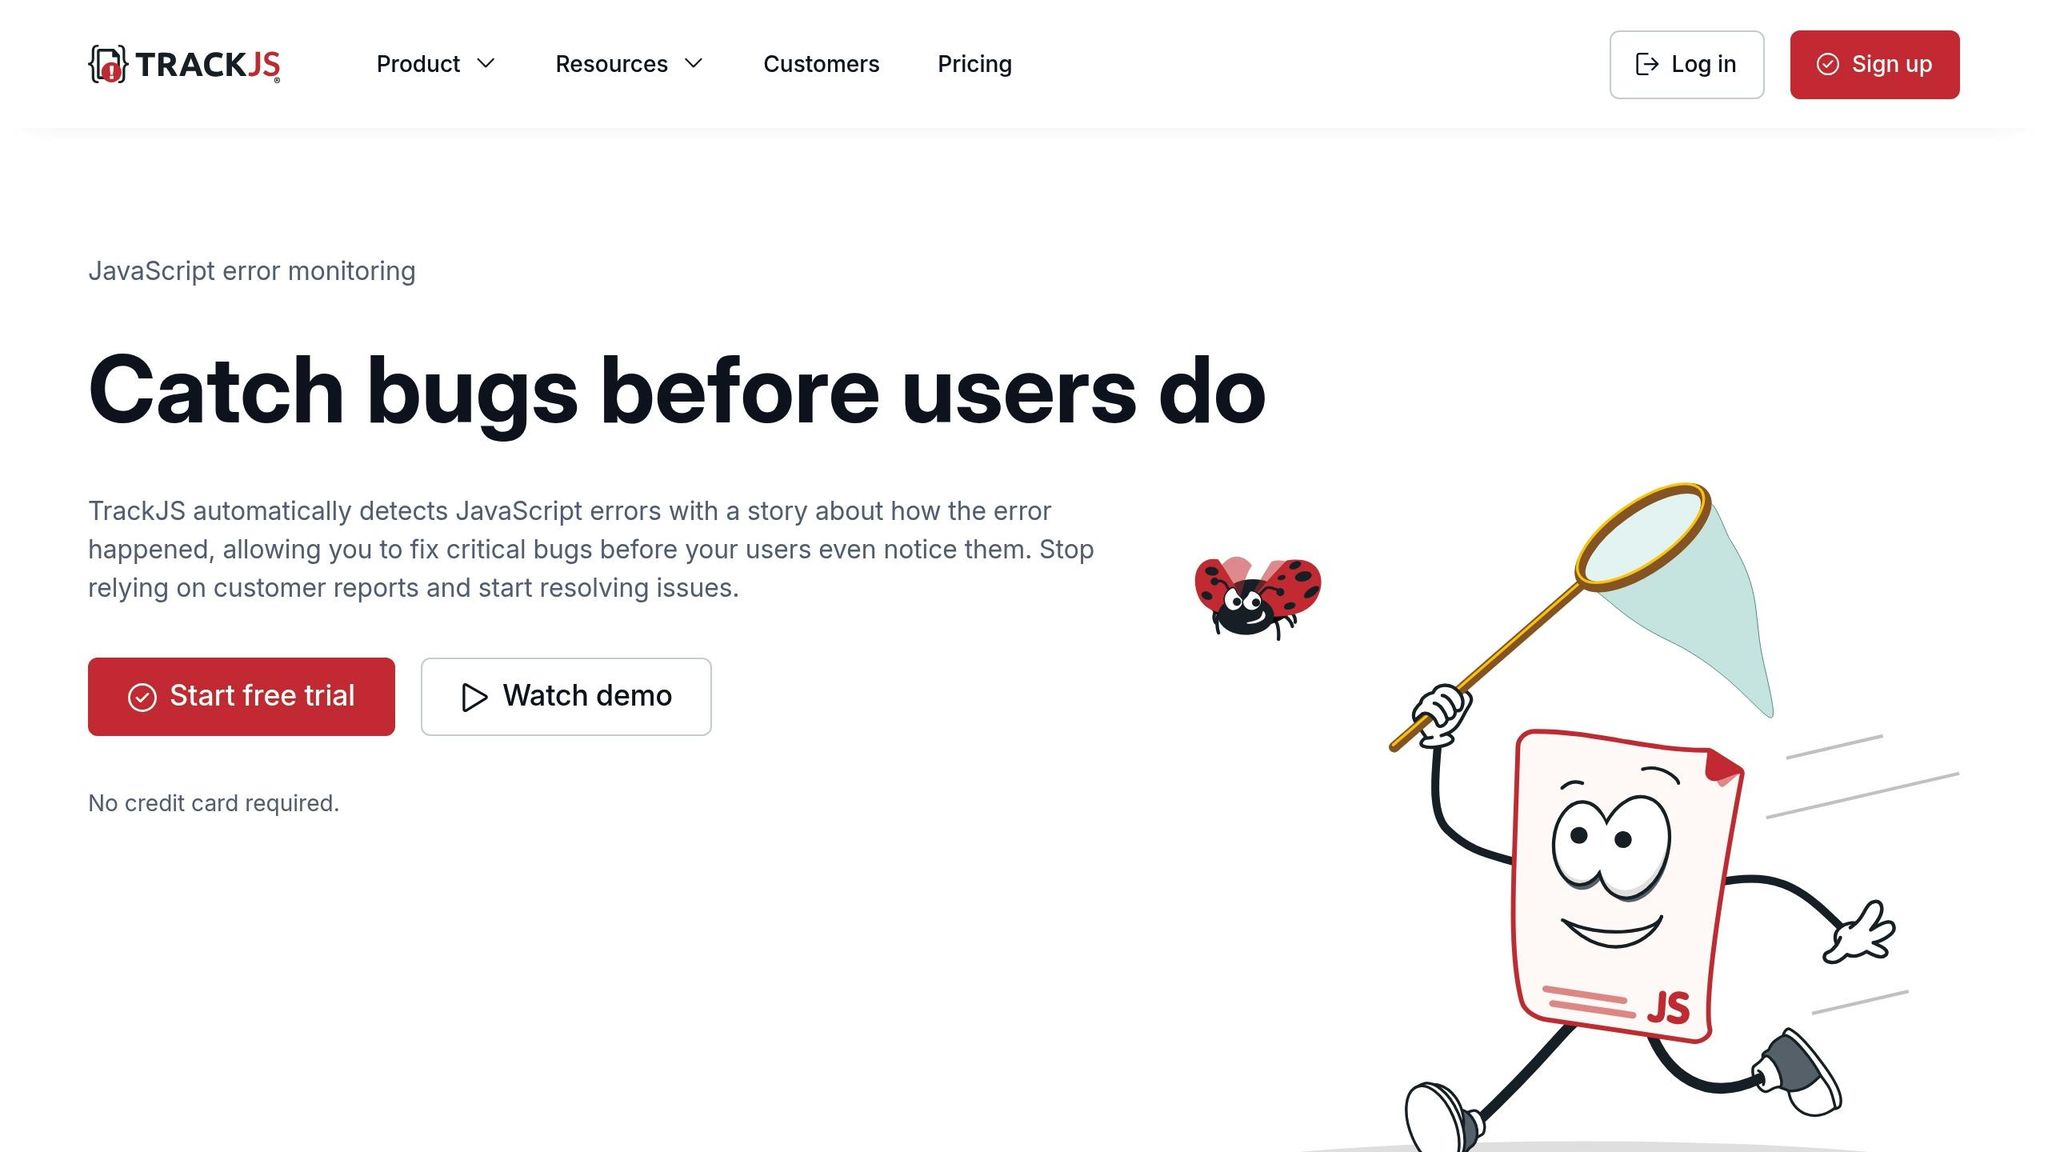
TrackJS is a specialized error monitoring tool designed to tackle JavaScript issues in web applications and Progressive Web Apps (PWAs). While it doesn’t support native iOS or Android apps, it’s a go-to solution for businesses relying on web technologies and PWAs for cross-platform functionality.
Real-time Error Reporting and Alerts
TrackJS captures JavaScript errors as they happen, providing immediate notifications and collecting crucial context like browser details, operating systems, and event sequences. This timeline of events is especially helpful for debugging those tricky, environment-specific problems.
You can set up alerts through email, Slack, or webhooks, tailored to error frequency, severity, or type. This way, you can address issues quickly before they impact too many users.
Support for Web and PWAs
For developers working on PWAs or using no-code platforms like AppInstitute, TrackJS delivers robust monitoring capabilities. It tracks errors across various browsers and devices, ensuring your PWA performs consistently whether accessed via Chrome on Android, Safari on iOS, or other browser setups.
The tool automatically identifies browser-specific glitches, network issues, and service worker failures – all common challenges for PWAs. This insight helps developers fine-tune their apps for the diverse range of mobile browsers and operating systems.
Custom Dashboards and Filters
With TrackJS, you can design custom dashboards to focus on the metrics that matter most to your project. Whether it’s tracking errors by user segments, geographic regions, or browser versions, the platform adapts to your needs.
Its powerful search feature lets you quickly locate errors using filters like error messages, file names, or user agents. You can even save these searches for recurring debugging tasks, making it easier to tackle ongoing issues.
Transparent Pricing and Flexible Plans
TrackJS offers a straightforward pricing model based on the number of errors captured each month. It starts with a free tier (up to 10,000 errors/month), with paid plans beginning at $39/month for up to 100,000 errors.
The pricing grows predictably with your app’s needs, without hidden fees. For agencies managing multiple clients, TrackJS includes team features and the ability to organize projects under separate accounts. This makes it simple to track costs and keep client data separate.
2. Rollbar
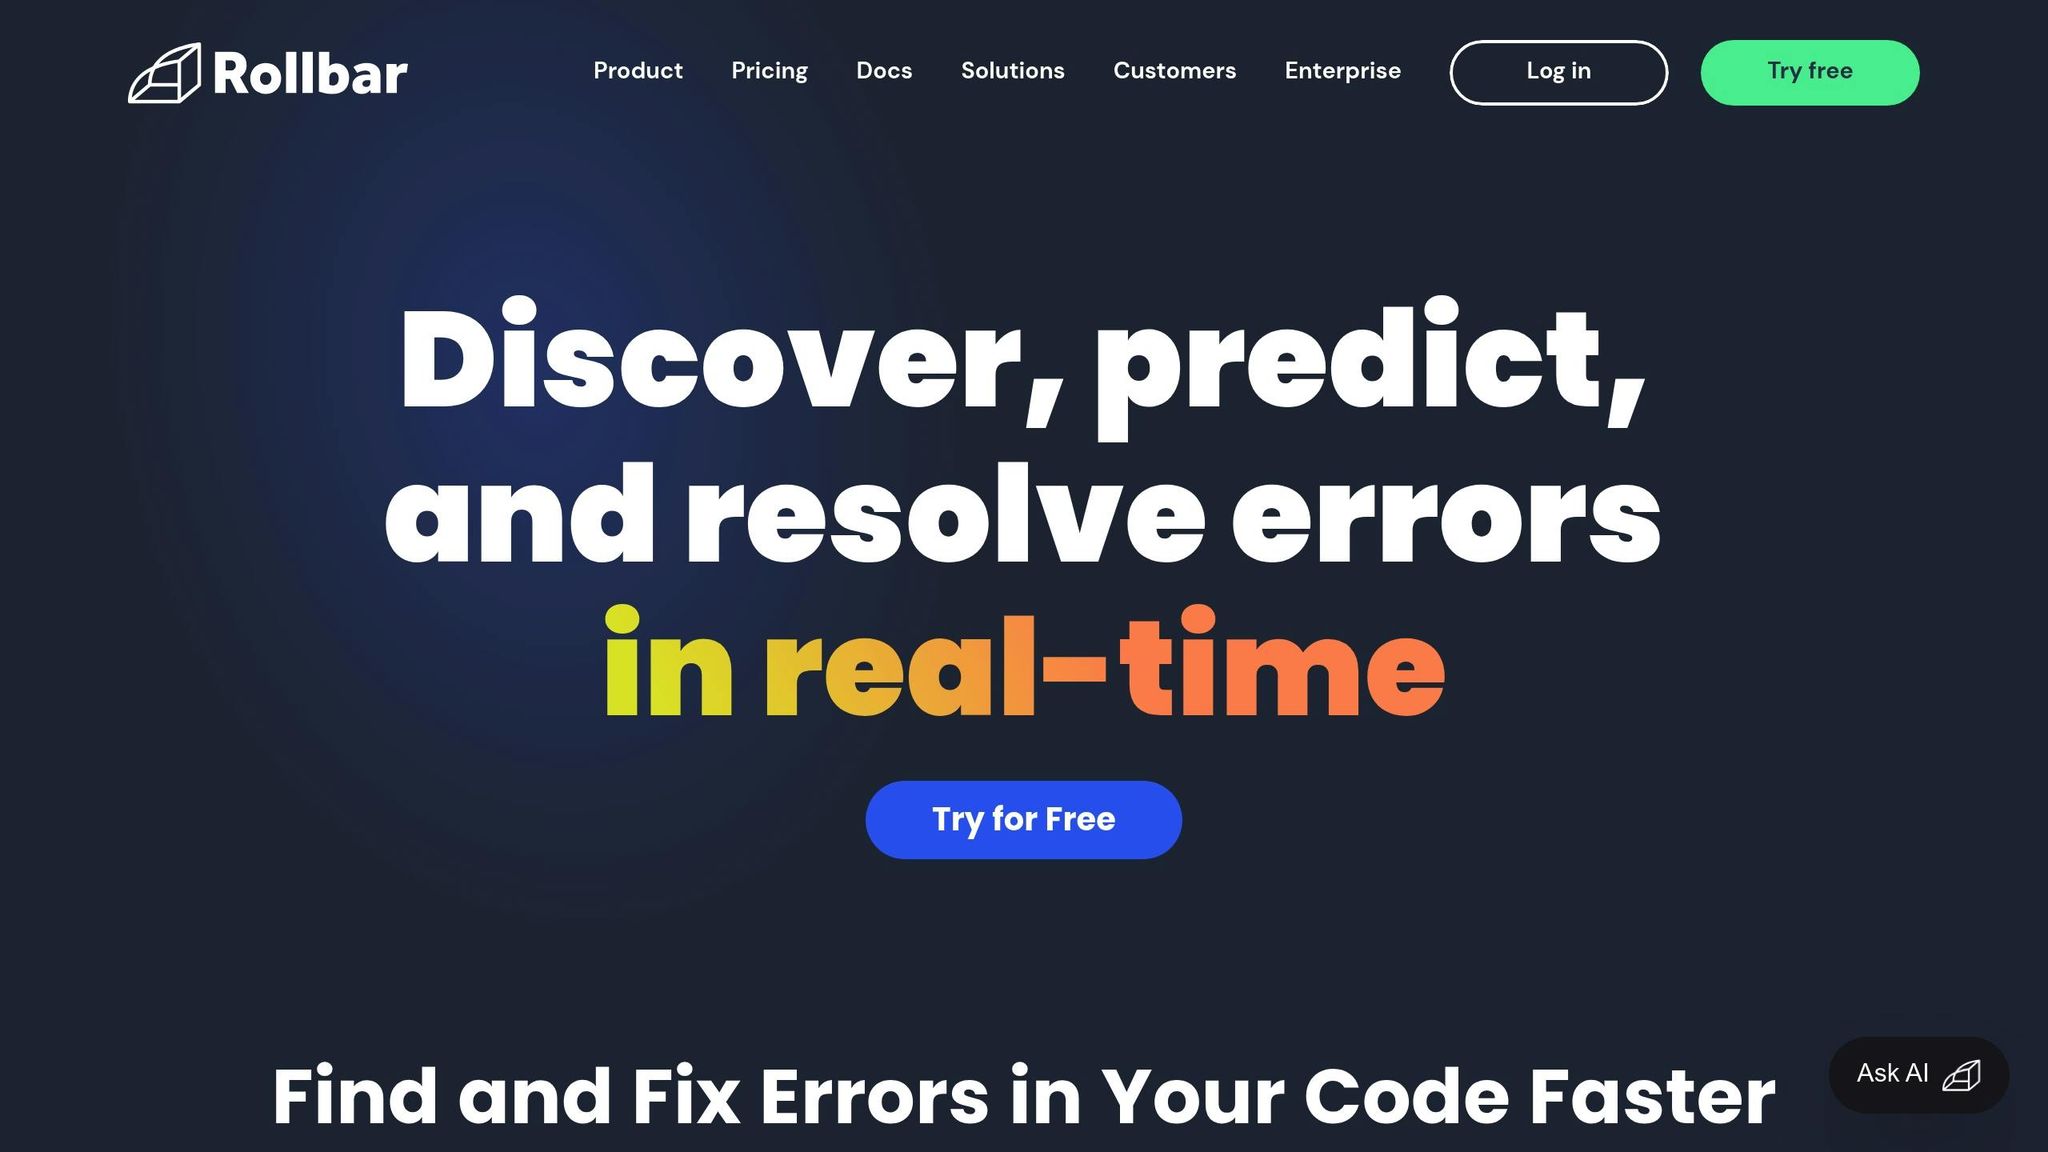
Rollbar is a robust error monitoring solution designed to support true cross-platform development. Whether you’re working with iOS, Android, web applications, or Progressive Web Apps (PWAs), Rollbar has you covered.
Multi-platform Support (iOS, Android, web, PWAs)
Rollbar provides native SDKs and integrations for iOS, Android, web, and PWAs, supporting more than 20 programming languages and frameworks. These include Swift, Java, Kotlin, JavaScript, Python, and .NET, among others.
For teams using no-code platforms like AppInstitute to build cross-platform applications, Rollbar’s capabilities ensure thorough error tracking. It automatically identifies platform-specific issues, offering clear insights into your app’s performance across different devices and operating systems. This makes it a one-stop solution for monitoring, regardless of how your app is developed.
Real-time Error Reporting and Alerting
Rollbar delivers instant notifications through email, Slack, PagerDuty, and webhooks. Its intelligent error grouping organizes similar issues together, reducing unnecessary alerts while ensuring that critical problems are addressed immediately.
With telemetry features, Rollbar tracks user actions leading up to errors, providing a detailed event timeline to simplify debugging. You can also configure custom alert rules to prioritize key issues, like payment failures, while summarizing less critical ones, such as minor UI glitches. These real-time insights are complemented by powerful dashboard tools to speed up the debugging process.
Customizable Dashboards and Filtering
Rollbar goes beyond notifications, offering customizable dashboards that help teams identify error patterns. These dashboards can be tailored to specific roles: developers might focus on errors tied to code deployments, while product managers might monitor user-impacting issues by region or device type.
Its advanced search and filtering tools allow you to locate specific errors quickly, using parameters like error messages, affected users, or deployment versions. Saved searches can be shared across teams, making collaborative debugging more efficient. For teams managing multiple applications, the cross-project search feature available in higher-tier plans helps identify trends and issues across the entire portfolio.
Pricing Transparency and Scalability
Rollbar uses a volume-based pricing model that many developers find more predictable than user-based alternatives. The free plan includes 5,000 error events per month with 30-day data retention, making it ideal for small projects or individual developers.
"Most reviewers indicate that Rollbar offers competitive pricing, with many appreciating the availability of a free plan that meets the needs of various users. They find the pricing structure, which is based on volume rather than the number of users, to be sensible and beneficial."
Paid plans start at $15.83 per month for the Essentials tier, which supports 25,000 events, and go up to $32.15 per month for Advanced features. Custom Enterprise plans, beginning at $25,000 annually, cater to high-volume applications handling over 80 million events monthly. Paid plans also include customizable rate limits to help manage costs and avoid unexpected charges.
Some users have noted that pricing might be a challenge for smaller teams. As Farzam T, Software Developer, puts it:
"The only downside with Rollbar is the cost. It can be a bit expensive for smaller teams or for those just getting started. But the features you get for the cost makes it worth it."
Rollbar also supports educational institutions and nonprofit organizations with a 50% discount on self-serve paid plans, making it more accessible for learning environments and mission-driven projects.
3. Raygun
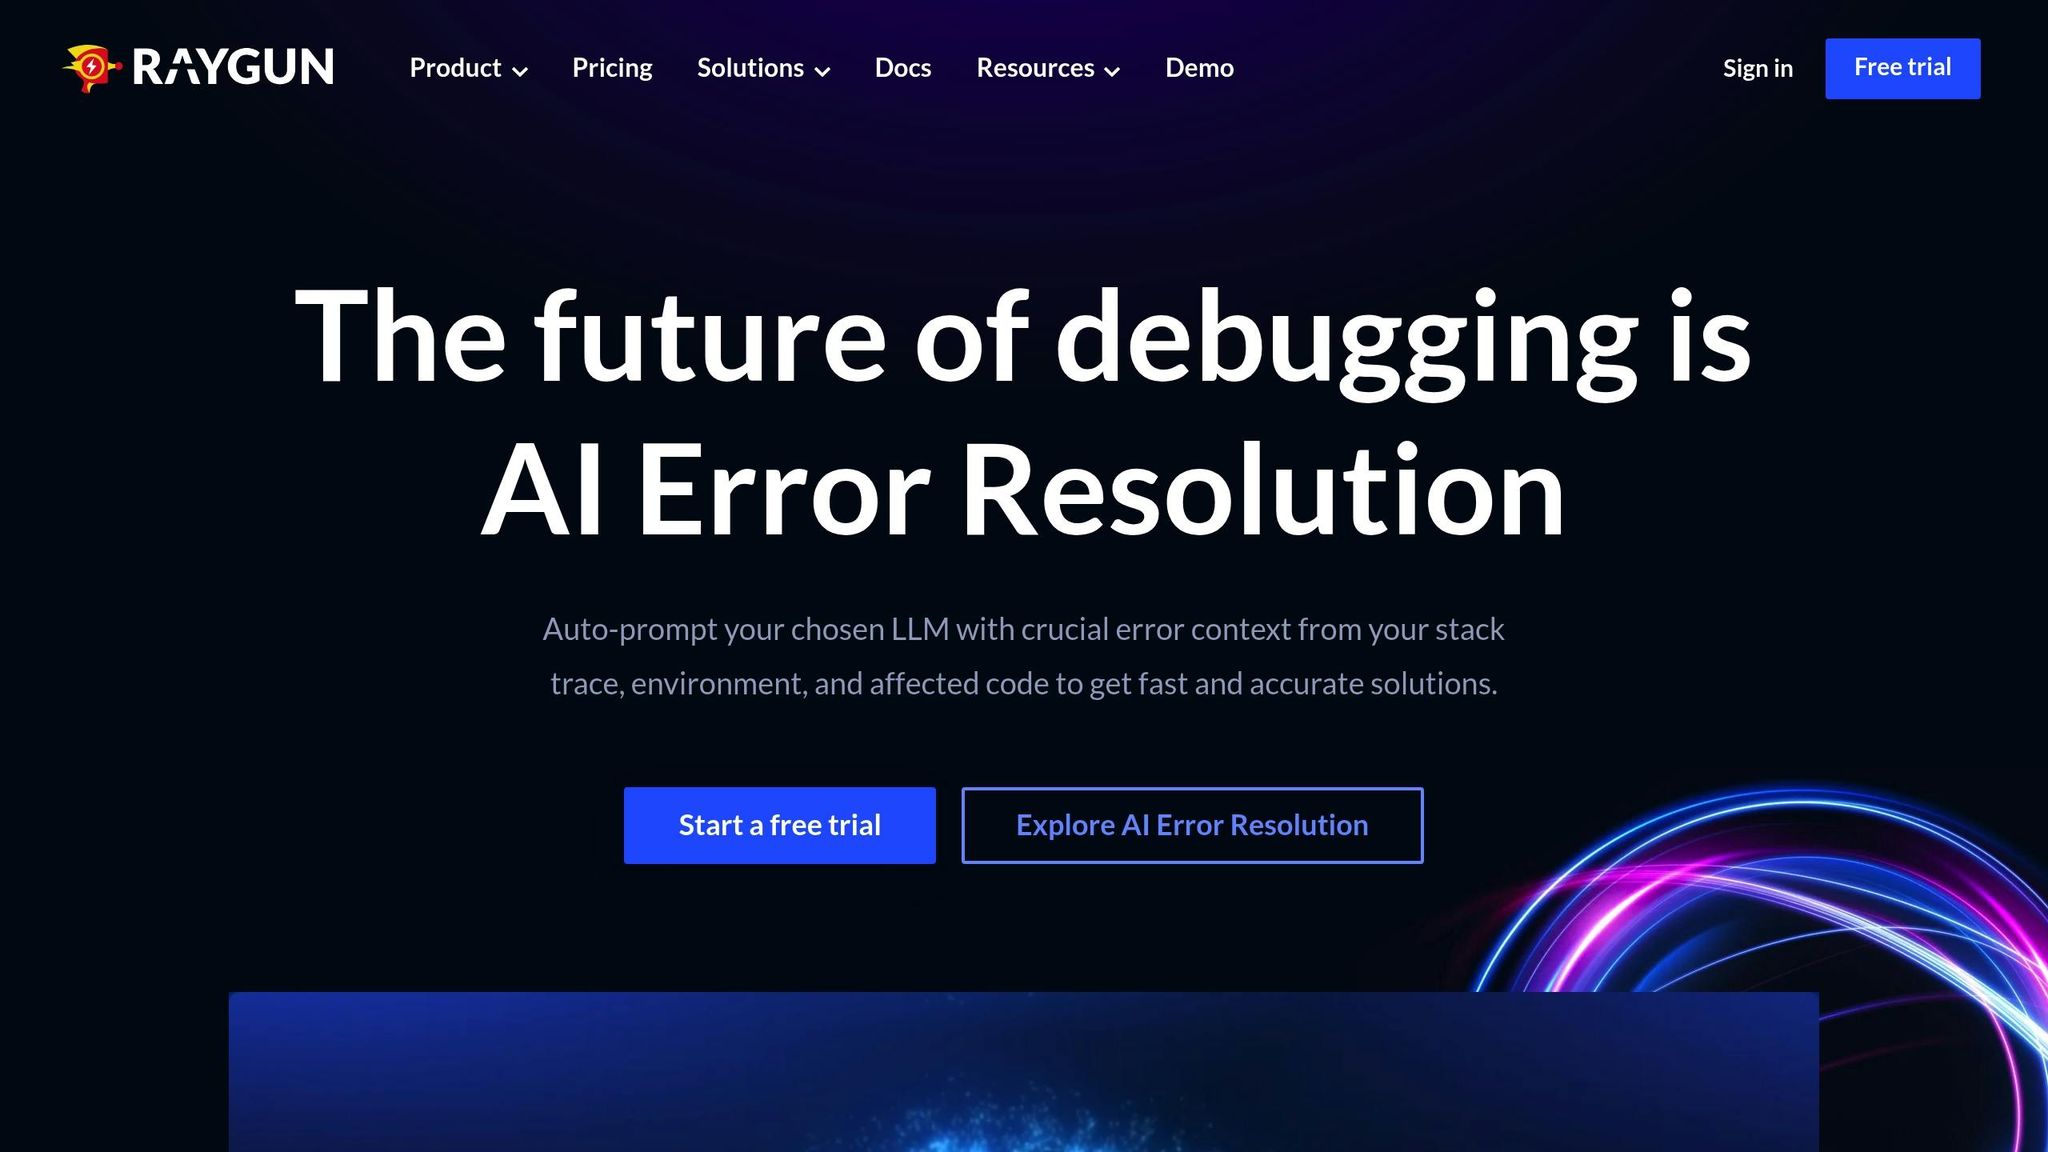
Raygun is a versatile tool for cross-platform monitoring, offering real-time insights into application performance and errors. It combines crash reporting, real user monitoring, and performance tracking, giving teams a clear view of application health across multiple platforms.
Multi-Platform Support (iOS, Android, Web, PWAs)
Raygun supports a wide range of platforms, including iOS, Android, web applications, and Progressive Web Apps (PWAs). It integrates seamlessly with popular frameworks like React Native, Xamarin, Flutter, and Ionic, making it a practical choice for teams developing apps that need consistent performance across different operating systems.
For web and PWA monitoring, Raygun’s JavaScript SDK captures platform-specific errors, such as native crashes on mobile devices and JavaScript exceptions in browsers. This unified monitoring approach allows teams to oversee their entire application ecosystem from a single dashboard, simplifying error tracking and improving efficiency.
Real-Time Error Reporting and Alerts
Raygun’s crash reporting system captures errors as they happen, providing detailed stack traces, user actions, and device information. To prevent teams from being overwhelmed, it groups similar errors together, ensuring critical issues are prioritized.
The platform’s alerting system integrates with tools like Slack, Microsoft Teams, and email, allowing teams to set custom notification rules based on error frequency, the number of affected users, or specific error types. Escalation policies can also be configured to notify team members based on error severity or response time needs.
Raygun’s Pulse feature takes monitoring a step further by tracking application performance in real time. It provides insights into page load times, API response times, and user interactions, helping teams address performance issues before they affect the user experience.
Customizable Dashboards and Filtering
Raygun doesn’t just collect data – it helps teams make sense of it. With customizable dashboards, team members can focus on what matters most to their roles. Developers can zero in on code-related issues from recent updates, while product managers can monitor user-impacting errors across different regions or devices.
The platform’s filtering tools allow teams to analyze error patterns using criteria like error message, affected users, app version, or time range. Saved searches and shared dashboard configurations ensure everyone in the organization stays aligned. Additionally, custom tags and metadata make it easy to organize and prioritize errors based on specific workflows.
Pricing Transparency and Scalability
Raygun offers a clear and flexible pricing structure based on the number of applications monitored and monthly error events.
- The Startup plan starts at $4 per month for one application with up to 8,000 errors, making it ideal for small teams or solo developers.
- The Small Business plan costs $49 per month, covering up to five applications and 80,000 errors.
- The Medium Business plan is priced at $149 per month, supporting 15 applications and 400,000 errors.
- For larger needs, the Enterprise plan starts at $399 per month, offering unlimited applications and customizable error limits.
All plans include unlimited team members, which can be a cost-effective option for larger teams compared to per-user pricing models. A 14-day free trial is available for all plans, allowing teams to explore the platform’s features risk-free.
Raygun also provides volume discounts for high-traffic applications and offers annual billing options that can reduce costs by up to 20%. A pricing calculator on their site helps teams estimate costs based on their specific needs.
4. AppDynamics

AppDynamics is a robust tool designed for businesses managing intricate, multi-tier, cross-platform applications. It’s built to provide deep insights into every layer of your application stack, offering a complete view of performance from start to finish.
Multi-Platform Support (iOS, Android, Web, PWAs)
With AppDynamics, cross-platform monitoring is seamless. It uses an agent-based system to track performance across iOS, Android, and web or PWA environments. Mobile apps are monitored through dedicated SDKs, while JavaScript agents handle web data. These agents collect metrics from client and server sides, tracing transactions end-to-end. By mapping interdependencies across application, server, and database layers, AppDynamics helps teams quickly identify how issues in one area might ripple through others.
Real-Time Error Reporting and Alerts
AppDynamics simplifies error management by grouping related operations into business transactions, making it easier to assess the impact of errors. Its health rules and integrations with tools like Slack, PagerDuty, and ServiceNow ensure teams are alerted immediately when something goes wrong. The platform also establishes baselines for normal behavior, flagging anomalies so potential problems can be addressed before they escalate.
Customizable Dashboards and Metrics
The platform’s dashboards are fully customizable, allowing teams to build views that suit their needs. With widgets and advanced filtering, users can quickly spot issues. Custom templates make it easy to replicate dashboard setups across multiple application tiers, while tailored dashboards can focus on metrics tied to past production issues – helping to prevent repeat problems.
Flexible Pricing and Scalability
AppDynamics offers enterprise-level pricing tailored to the number of monitored instances and additional features. It’s designed to scale for global deployments and provides dedicated support to meet the needs of large organizations. For those considering the platform, it typically includes proof-of-concept deployments and trial periods. This allows teams to test its capabilities in their specific environment before committing. AppDynamics is a comprehensive tool that closes the gap on performance monitoring, as highlighted in the upcoming comparison table.
sbb-itb-539ae66
5. SolarWinds AppOptics
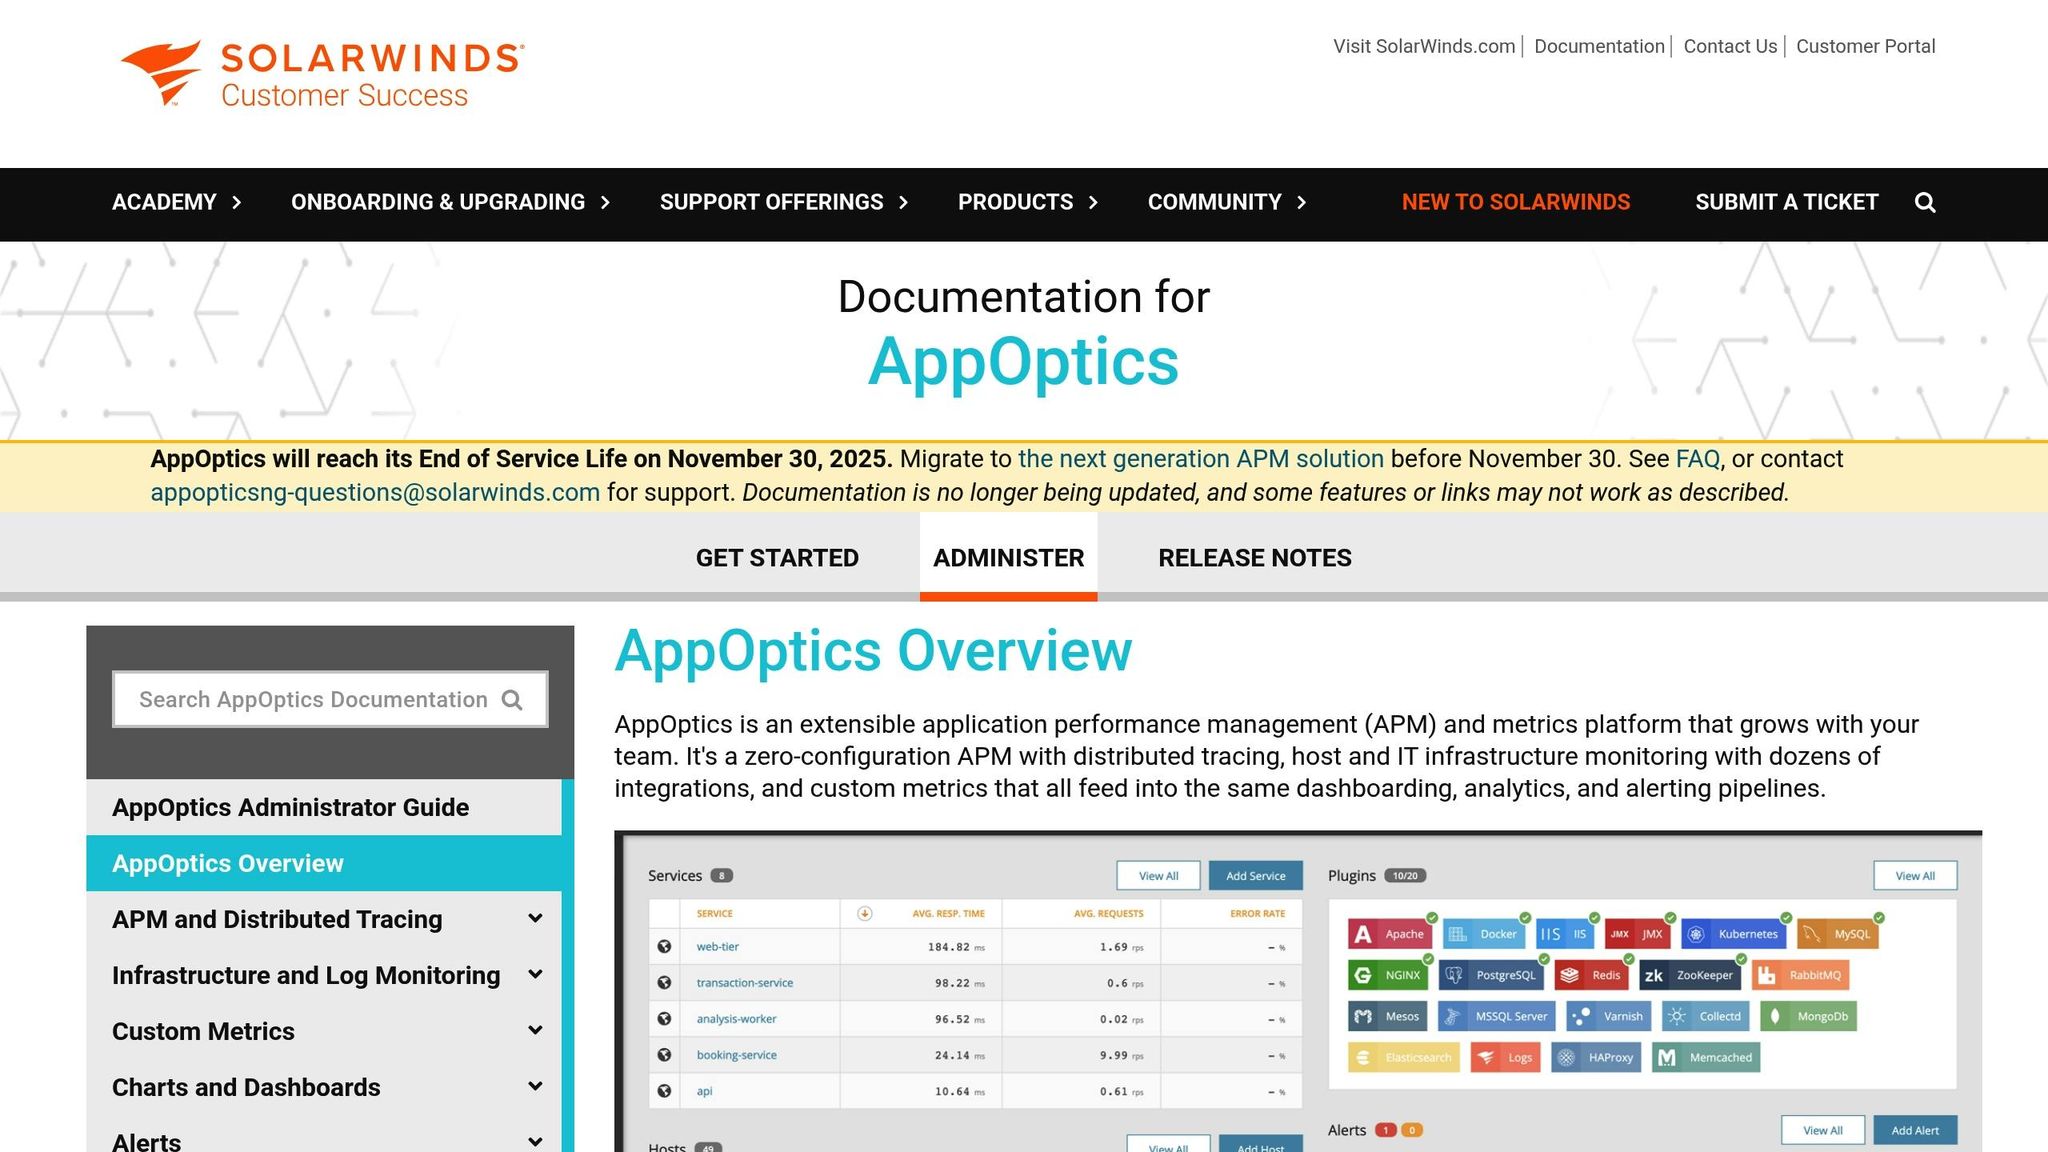
SolarWinds AppOptics is a cloud-based solution designed to track and diagnose errors across mobile apps, websites, and Progressive Web Apps (PWAs).
Multi-Platform Support
AppOptics works seamlessly across iOS, Android, web applications, and PWAs. Its efficient agents and SDKs trace user interactions from the front end to the back end, making it easier to pinpoint how errors spread through the system.
Real-Time Error Reporting and Alerts
To help teams stay ahead of issues, AppOptics groups similar errors together, cutting down on unnecessary alerts. It also integrates with popular communication tools, ensuring timely notifications with all the context teams need to act quickly.
Customizable Dashboards and Filtering
With customizable dashboards and advanced filtering options, teams can zero in on the metrics that matter most. Whether it’s breaking down performance by device type or operating system, AppOptics makes it simple to visualize and manage cross-platform errors.
Pricing and Scalability
SolarWinds AppOptics offers flexible pricing and is designed to grow alongside your application needs. A free trial is available for those who want to explore its features firsthand.
6. Honeycomb
Honeycomb is an observability platform designed to give you a deep understanding of your application’s behavior. It doesn’t just tell you what went wrong – it helps uncover why it happened and how to stop it from happening again.
Multi-Platform Support
Honeycomb’s instrumentation libraries are built to work smoothly across iOS, Android, web apps, and Progressive Web Apps (PWAs). It supports popular frameworks like React Native, Flutter, and Xamarin. The lightweight SDKs integrate easily into your app without slowing it down, all while automatically capturing detailed telemetry data from user interactions on supported platforms.
One of Honeycomb’s standout features is its distributed tracing. It excels at tracking issues that span multiple services or platforms. For instance, if a problem starts with an API call in your mobile app and then cascades through backend services to your PWA, Honeycomb maps the entire chain of events. This end-to-end visibility makes it easier to pinpoint exactly where and how issues are spreading – something not highlighted in earlier tools.
This seamless integration lays the groundwork for Honeycomb’s advanced alerting capabilities.
Real-Time Error Reporting and Alerting
Honeycomb uses high-cardinality data to spot subtle anomalies that might not show up in traditional metrics. Its alerting system can identify small but meaningful changes in error rates, response times, or user behavior patterns – often catching issues before they escalate into major problems.
With query-driven alerts, teams can set up highly specific notifications. For example, you can create alerts that trigger if error rates spike for users on older Android devices using a particular feature, instead of relying on generic error thresholds. This level of precision ensures you’re addressing the right problems without unnecessary noise.
Customizable Dashboards and Filtering
Honeycomb prioritizes exploratory analysis over static dashboards. Its intuitive query interface lets developers dig into data and filter it by attributes like device type, user segment, feature flag status, or deployment version. This flexibility makes it easy to uncover trends and patterns.
The BubbleUp feature takes this a step further by automatically highlighting which combinations of attributes are most closely linked to errors or performance issues. Instead of manually setting filters to hunt for problematic patterns, BubbleUp surfaces the most relevant insights for you, saving valuable debugging time. These tools enhance the monitoring experience, giving teams the power to act quickly and effectively.
Pricing Transparency and Scalability
Honeycomb offers a usage-based pricing model that adjusts to your data volume. For smaller teams or startups, there’s a free tier that includes up to 20 million events per month. For larger applications, enterprise pricing is based on factors like data retention periods and monthly event volume, with custom options available for high-volume needs.
To help manage costs, Honeycomb’s smart sampling feature captures the most important events while reducing routine data. This ensures you maintain high-quality insights without unnecessary expenses or storage overhead.
7. Instana
Instana takes a modern, AI-powered approach to observability, making it a strong contender among error monitoring tools for cross-platform apps. This enterprise-grade platform automatically maps your entire application stack, identifying performance issues without requiring extensive manual configuration.
Multi-Platform Support
Instana excels at managing apps across multiple platforms. Using lightweight agents, it can automatically discover and monitor iOS, Android, web apps, and PWAs. Its dependency mapping feature tracks interactions between mobile apps, backend services, databases, and third-party integrations, simplifying the debugging process for cross-platform environments.
With high-frequency monitoring, Instana allows you to catch issues almost as they happen. Whether it’s a slow API call in a mobile app or a service worker problem in a PWA, the platform provides detailed insights. It also pinpoints the root cause of errors, whether they stem from a sluggish database query, a failing microservice, or an external API timeout.
Real-Time Error Reporting and Alerting
Instana’s real-time error detection is powered by AI, which learns your app’s typical behavior and spots anomalies before they escalate. Instead of bombarding your team with multiple alerts for related issues, Instana intelligently groups these incidents into a single, actionable notification. For instance, if a backend service failure impacts several platforms, it’s presented as one incident, helping your team focus on solving the core problem.
Each alert comes with valuable context, such as system performance snapshots, recent deployments, and configuration changes. This additional information speeds up troubleshooting by giving you a clearer picture of what might have triggered the issue.
Customizable Dashboards and Filtering
Instana’s dashboards are highly customizable, allowing you to filter data by device type, operating system version, geographic location, or even custom metrics. For example, you could identify that errors are more common among users with older Android versions in specific regions.
The platform’s application perspective feature tailors views for different stakeholders. Mobile developers can hone in on client-side performance, backend engineers can focus on server-side metrics, and business teams can monitor overall user experience – all using the same data, but presented in ways that suit their needs. Tools like heat maps and topology views provide clear visualizations of your app’s health, making it easier to spot trends and areas needing attention.
Pricing Transparency and Scalability
Instana uses a host-based pricing model with volume discounts, making it easier to manage costs as your monitoring needs grow. For businesses with complex cross-platform setups, enterprise pricing tiers offer perks like extended data retention, advanced analytics, and dedicated support. The platform’s automatic scaling ensures consistent performance, even as the volume of monitoring data increases.
Tool Comparison Table
When choosing an error monitoring tool, it’s essential to weigh your needs, budget, and technical requirements. Below is a detailed table comparing seven popular tools to help you make an informed decision.
| Tool | Supported Platforms | Real-Time Monitoring | Key Features | Pricing (USD) | Best For |
|---|---|---|---|---|---|
| TrackJS | Web, PWA, React Native | Yes | JavaScript error tracking, session replay, detailed stack traces | $39/month (Starter), $99/month (Professional) | Small to medium web apps with heavy JavaScript usage |
| Rollbar | iOS, Android, Web, PWA | Yes | Real-time error grouping, deploy tracking, RQL query language | $12/month (Essentials), $49/month (Advanced) | Teams needing affordable cross-platform coverage |
| Raygun | iOS, Android, Web, PWA | Yes | Crash reporting, real user monitoring, deployment tracking | $4/month per app (Startup), $199/month (Business) | Businesses seeking combined error monitoring and performance insights |
| AppDynamics | iOS, Android, Web, Enterprise apps | Yes | Full-stack observability, business impact correlation, AI analytics | Custom enterprise pricing (typically $6,000+ annually) | Large enterprises with complex application ecosystems |
| SolarWinds AppOptics | Web, Mobile, Cloud platforms | Yes | Infrastructure monitoring, distributed tracing, custom dashboards | $7.50/host/month (Infrastructure), $15/host/month (Full-Stack) | Organizations needing both application and infrastructure monitoring |
| Honeycomb | iOS, Android, Web, Microservices | Yes | High-cardinality observability, query-driven debugging, distributed tracing | $1/million events (Pro), Custom enterprise pricing | Engineering teams building complex, distributed systems |
| Instana | iOS, Android, Web, PWA | Yes | AI-powered monitoring, automatic discovery, dependency mapping | Host-based pricing with volume discounts (enterprise focus) | Large-scale applications requiring comprehensive observability |
This table highlights each tool’s core features, but understanding their differences can help narrow down the right fit for your specific needs.
Pricing and Budget
The pricing models vary significantly across these tools. For budget-conscious teams, Rollbar offers affordable plans without skimping on essential features. On the other hand, enterprises often lean toward AppDynamics or Instana, which cater to complex environments but come with higher costs. Raygun strikes a balance with scalable per-app pricing, making it a great option for growing businesses.
Platform Strengths
While all tools support real-time monitoring across various platforms, their strengths lie in different areas. TrackJS is a top choice for JavaScript-heavy applications, whereas AppDynamics shines in enterprise settings with its robust application support. For cross-platform mobile apps, Raygun and Instana stand out with strong native SDK integration.
Real-Time Monitoring and Features
Every tool on this list provides real-time monitoring, but the execution varies. Honeycomb is ideal for microservices, offering rapid data capture and query-driven debugging. Instana, on the other hand, uses AI to group related incidents intelligently, reducing alert fatigue and simplifying issue management.
Team Size and Expertise
Your team’s size and technical skill level play a big role in choosing the right tool. Smaller teams often prefer TrackJS or Rollbar for their simplicity and ease of setup. Larger engineering organizations, however, may benefit from the advanced querying capabilities of Honeycomb or the detailed dashboards offered by AppDynamics.
No-Code and Mobile-Friendly Options
For no-code developers using platforms like AppInstitute, ease of integration is key. Tools like Raygun and Rollbar combine strong mobile support with straightforward setup, making them ideal for developers who prioritize simplicity without sacrificing functionality.
Conclusion
Selecting the right error monitoring tool is crucial – it needs to align with your tech stack, team size, and the type of apps you’re building. Pick the wrong tool, and you risk missing critical issues. But the right one? It ensures thorough monitoring, quick alerts, and helps your team address problems before they impact users, directly influencing both your technical efficiency and user satisfaction.
Your development style also plays a big role. For traditional development teams with ample technical resources, tools like AppDynamics or Instana offer in-depth observability. However, these solutions can demand significant setup and maintenance. On the other hand, no-code development teams, such as those using AppInstitute, often have different needs.
For no-code developers, seamless integration is key. Tools like Raygun and Rollbar stand out for their cross-platform support and simple setup. When building iOS, Android, and Progressive Web Apps with a drag-and-drop interface, you want monitoring solutions that are easy to use and don’t require extensive technical know-how.
Effective error monitoring helps catch issues early, ensuring better app quality and preventing a single bug from spreading across multiple platforms. Budget also plays a role – some teams stick with cost-efficient tools that cover the basics, while others invest in advanced features and dedicated support.
Ultimately, the best tool is the one that fits your current needs and scales with you as you grow. Whether you’re managing a complex enterprise app or crafting streamlined no-code projects on AppInstitute, focus on tools that offer easy integration, real-time alerts, and compatibility across platforms. The right choice ensures your app performs reliably, no matter where or how it’s used.
FAQs
What should I look for in an error monitoring tool for my cross-platform app?
When picking an error monitoring tool for your cross-platform app, focus on features that help you pinpoint and fix problems efficiently. Tools that offer detailed error reports – complete with stack traces and metadata – can provide a clear understanding of what went wrong and why. Another helpful feature to consider is session replay, which lets you see user actions leading up to the error, giving you valuable context.
It’s also important to choose a tool that works smoothly across multiple platforms and devices, offering real-time insights for iOS, Android, and web apps. This unified approach ensures you can track performance and enhance the user experience across your entire app ecosystem. Finally, think about practical aspects like ease of integration, scalability, and whether the tool aligns with your budget and technical requirements.
How do error monitoring tools help enhance app performance and user experience?
Error monitoring tools are essential for keeping apps running smoothly and ensuring a positive user experience. They help pinpoint issues like crashes, bugs, and performance slowdowns as they happen, giving developers the information they need to address problems quickly.
By keeping apps stable and responsive, these tools help cut down on interruptions, reduce downtime, and keep users happy. They allow developers to tackle issues proactively, ensuring a more seamless experience across different platforms.
What are the best error monitoring tools for no-code app development platforms?
When building apps on no-code platforms, having the right error monitoring tools can make all the difference. Tools like Sentry, Raygun, and Bugsnag are popular options because they’re easy to use and integrate seamlessly into no-code environments.
These tools offer essential features like real-time error detection, crash reporting, and performance tracking. Their straightforward setup and functionality allow you to quickly spot and address issues, keeping your app running smoothly and delivering a polished experience for users.
Related Blog Posts
- Improving App Responsiveness: Key Metrics To Track
- Guide to Cross-Platform UI Component Libraries
- How to Automate User Onboarding in Apps
- How to Optimize Background Tasks for Mobile Apps
Last Updated on October 4, 2025 by Ian Naylor
0 thoughts on “Top 7 Error Monitoring Tools for Cross-Platform Apps”