
Tracking in-app user behavior is essential for understanding how users interact with your app and improving their experience. This involves monitoring actions like screen views, button clicks, and session durations to identify what works and what doesn’t. Apps that analyze user behavior effectively can boost conversion rates by up to 20%. However, with 71% of users expecting apps to load in under 3 seconds, it’s critical to focus on speed and usability.
Here’s how to get started:
- Define Goals: Align your tracking with business objectives, such as increasing revenue or improving retention.
- Track Key Metrics: Focus on metrics like Daily Active Users (DAU), retention rates, and conversion events (e.g., “Sign-up Completed”).
- Use No-Code Tools: Platforms like AppInstitute simplify tracking with built-in analytics dashboards and event tagging.
- Map User Journeys: Identify where users drop off or engage to optimize key flows like onboarding or checkout.
- Analyze Data: Use methods like funnel analysis and session replays to pinpoint friction points and improve usability.
“The biggest shift for us was realising our app wasn’t being used the way we assumed. Tracking in-app behaviour showed us exactly where users hesitated, skipped features, or dropped off — and that changed our roadmap completely.” Chris – AppInstitute Customer
How Can You Track User Behavior On Your App?
Planning What to Track in Your App
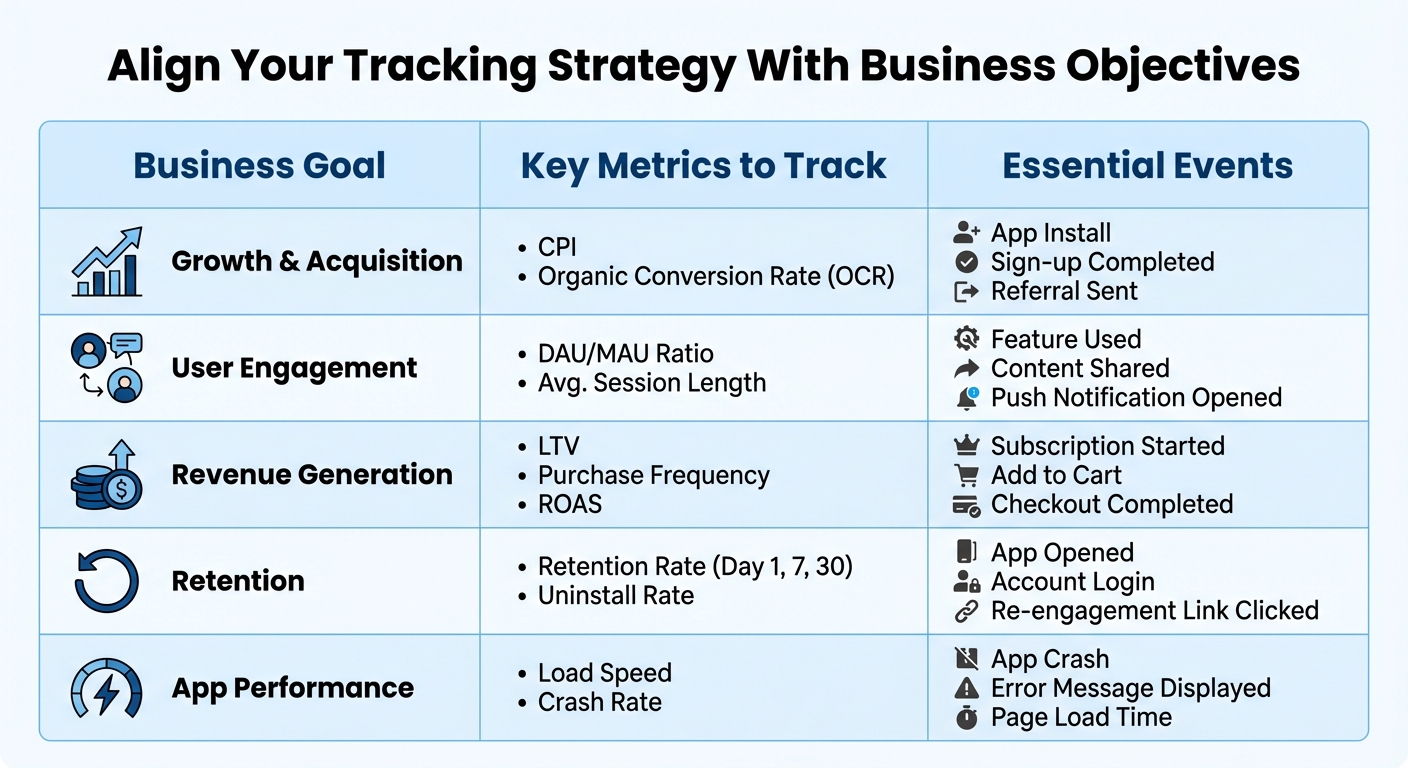
Key Metrics to Track by Business Goal for Mobile Apps
Matching Metrics With Business Goals
Before diving into tracking, take a step back and define what success looks like for your app. A fitness app aiming to grow subscription revenue will need to track different metrics than, say, a restaurant app focused on increasing repeat orders. The key is aligning your measurements with your goals.
“In our experience, behaviour tracking is the fastest way to improve retention. Once we identified where users stopped engaging, small tweaks had an immediate impact on repeat usage.” David Hall, CEO AppInstitute
Think of Key Performance Indicators (KPIs) as your big-picture business targets – like boosting revenue by 15% this quarter. Then, identify the specific metrics that will help you achieve those targets, such as average session length or uninstall rates. For growth, you might focus on events like “Sign-up Completed” or “Referral Sent” and track metrics like Cost Per Install (CPI). For retention, keep an eye on Day 1, 7, and 30 retention rates, along with events like “App Opened” or “Account Login.”
A handy framework to guide your strategy is the RAE model: Reach (how users discover your app), Activation (when users first experience its value), and Engagement (how they continue using it). This approach helps you avoid vanity metrics – like total downloads – that might look impressive but don’t necessarily reflect long-term user value.
“Start by listing a handful of key events that help understand user behavior and the path to activation – ignore everything else for the time being.” – Arpit Choudhury, Founder, astorik
Core Metrics and Events to Track
Focus on metrics that truly reflect your app’s health. Daily Active Users (DAU) and Monthly Active Users (MAU), for instance, can reveal how “sticky” your app is. The DAU/MAU ratio shows the percentage of monthly users who return daily. Retention rates are another critical indicator – especially since the average Android app loses about 80% of its daily active users within the first three days and 90% within the first month.
For apps centered on revenue, track Lifetime Value (LTV), Purchase Frequency, and events like “Subscription Started” or “Checkout Completed.” If you’re running campaigns, don’t forget to monitor performance metrics such as load speed and crash rates.
“Tracking in-app behaviour removed guesswork from product decisions. Instead of debating opinions, we could see what users actually did — and prioritise fixes that mattered.” Ian Naylor, Founder of AppInstitute
Keep your tracking efforts streamlined. Simple apps might need around 20 tracked events, while more complex ones could require up to 200. Limit each event to no more than 20 properties to ensure your data remains clean and manageable. Use event properties to capture details about specific actions (e.g., the price of an item added to a cart) and user properties for persistent traits like subscription type or language preference.
| Business Goal | Key Metrics to Track | Essential Events |
|---|---|---|
| Growth & Acquisition | CPI, Organic Conversion Rate (OCR) | App Install, Sign-up Completed, Referral Sent |
| User Engagement | DAU/MAU Ratio, Avg. Session Length | Feature Used, Content Shared, Push Notification Opened |
| Revenue Generation | LTV, Purchase Frequency, ROAS | Subscription Started, Add to Cart, Checkout Completed |
| Retention | Retention Rate (Day 1, 7, 30), Uninstall Rate | App Opened, Account Login, Re-engagement Link Clicked |
| App Performance | Load Speed, Crash Rate | App Crash, Error Message Displayed, Page Load Time |
Once you’ve nailed down your key metrics, use them to visualize the user journey and uncover any friction points.
Mapping User Journeys
After deciding what to track, map out the critical paths users take within your app. Start with your activation event – the action that indicates a user has found value, such as “First Purchase Completed” or “Project Created.” From there, work backward to identify the steps leading up to that moment.
For example, in a purchase flow, the journey might include steps like “Search Completed”, “Product Details Viewed”, “Product Added”, and “Order Reviewed.” For onboarding, track events like “Tutorial Started”, “Profile Completed”, and “First Feature Used.” By mapping these paths, you can pinpoint where users drop off – if only 40% complete checkout, for instance, you’ll know where to focus your efforts.
Consistency is key when naming events. Stick to a clear format, such as “Object-Action” (e.g., “Song Played” rather than “Played Song”), and use a consistent style like snake_case (e.g., sign_up_completed). This keeps your data organized and prevents duplicate events. Also, remember that mission-critical events like purchases should be tracked server-side for reliability, while client-side tracking works best for context-rich data like UTM parameters or referrers.
Track interactions that answer meaningful questions, such as “What percentage of new users reach the activation event?” or “Where do users drop out of the onboarding process?”. As your app evolves, adjust your tracking priorities. New features might require detailed monitoring, while established products should focus on adoption, retention, and reducing churn.
Setting Up In-App Behavior Tracking
Event Tracking Basics
In-app tracking revolves around two key elements: events and properties. An event represents a specific action, like “registration”, “add_to_cart”, or “tutorial_completed.” Each event is accompanied by parameters – key-value pairs that provide additional context. For instance, a purchase event could include parameters such as “item_category” or “price” to specify what was purchased and at what cost.
When creating events, it’s essential to assign a Customer User ID (CUID). This allows you to link in-app behavior with external data sources. Stick to predefined naming conventions (e.g., af_purchase) for consistency and to ensure accurate mapping. For revenue fields like af_revenue, only use numeric values (including decimals) to prevent reporting errors.
Start by identifying 3–5 core events that align with your business objectives, such as registration, tutorial completion, or adding items to a cart. These core events will provide a solid foundation for your tracking strategy. As your app grows, you can expand the scope of your tracking, but keeping it simple at the start ensures cleaner, more reliable data.
By laying this groundwork, you’ll be ready to take full advantage of built-in analytics tools in the next phase.
Using Built-In Analytics Tools
Once your app is live, AppInstitute’s built-in analytics automatically tracks critical metrics, saving you time and effort. This feature complements your custom events by capturing essential data without requiring additional coding. Key metrics include iOS and Android downloads, app opens, and customer retention (new vs. returning users). For apps with transactions, you’ll also receive daily earnings reports and detailed revenue breakdowns to monitor sales performance.
One particularly useful feature is push notification tracking. The dashboard reveals whether app opens are organic or driven by specific push campaigns, giving you insights into the messages that resonate most with users. As AppInstitute states:
“Whether organic or incentivized by a push notification campaign, you can learn what drives your customers to use your app”.
For more advanced analysis, you can integrate Google Analytics directly through the platform. Additionally, the Data Forms feature allows you to collect user feedback, RSVPs, or other inputs, making it easy to track user intent and interactions.
| Feature | What It Tracks | Why It Matters |
|---|---|---|
| App Opens | Organic vs. Push-driven | Assess the effectiveness of campaigns |
| Customer Retention | New vs. Returning users | Monitor long-term engagement |
| Revenue Reports | Daily earnings & sales data | Evaluate transaction success |
| Google Analytics | Advanced custom event tracking | Gain deeper insights |
| Data Forms | RSVPs, feedback, and inputs | Collect specific user data |
Setting Up Campaign Tagging
Campaign tagging takes your analytics to the next level by connecting in-app user behavior to your marketing efforts. This feature lets you calculate ROI and pinpoint which channels bring in the most engaged users. Start by using the built-in analytics dashboard to compare organic app opens with those triggered by push notification campaigns.
For more detailed tracking, integrate Google Analytics. This setup enables you to track users across various marketing channels and attribute in-app events to specific campaigns or media sources. When creating custom events for campaigns, use only lowercase alphanumeric characters without spaces to avoid errors.
Focus on tracking the same core events you defined earlier – like registration, purchases, or tutorial completions – to evaluate the quality of users from different campaigns. Offline interactions are also supported, with up to 40 events cached for later transmission, ensuring that no valuable campaign data is lost.
sbb-itb-539ae66
Analyzing In-App User Behavior
Methods for Behavior Analysis
Transforming raw data into meaningful insights is crucial for understanding user behavior. One effective approach is funnel analysis, which tracks conversion and drop-off rates at each stage of key processes, such as onboarding or checkout. For instance, if 100 users begin your registration process but only 40 complete it, funnel analysis helps identify where the remaining 60 drop off.
Another valuable method is path analysis, also called user flow mapping. This technique visualizes the actual journeys users take through your app, uncovering deviations from expected flows. For example, users might skip tutorials or take unexpected routes to access features. Similarly, cohort analysis groups users by shared characteristics – like signup date or acquisition source – and tracks behavioral changes over time. This is especially useful for evaluating whether app updates improve retention or whether users from specific marketing campaigns stay engaged.
To get a deeper understanding, pair these quantitative methods with qualitative tools. Session replays and heatmaps provide visual insights into user behavior, such as “rage clicks” on non-functional elements or features that go unnoticed. Considering that the average mobile session lasts only 2 to 3 minutes, pinpointing and addressing these friction points quickly is essential.
Segmentation adds another layer of insight by grouping users based on demographics, behavior, or platform. For instance, power users might gravitate toward advanced features, while casual users may need a more straightforward onboarding process. By tailoring experiences to these groups, you can focus on the changes that have the most impact.
While in-app analytics offers a wealth of information, integrating external tools can provide an even more comprehensive understanding.
Connecting App Data With External Tools
AppInstitute’s built-in analytics dashboard covers most tracking needs, but external tools can take your analysis further. For example, integrating Google Analytics allows for custom queries and tracking users across multiple touchpoints. You can also export data to platforms like BigQuery or Snowflake for advanced reporting. This enables you to merge in-app behavior data with metrics like financial performance or customer support records, creating a broader view for cross-team reporting.
Customer Data Platforms (CDPs) such as Segment, mParticle, and Tealium simplify the process of sharing data between your app and various marketing tools. These platforms centralize data collection and distribution, connecting with email marketing services, advertising platforms, and more. A critical step in this process is ensuring identity resolution – using consistent user identifiers (like email addresses or internal IDs) across all tools to maintain a unified view of the user journey.
To avoid issues like data contamination, set up separate environments for testing and production. When updating tracking codes for external tools, batch these changes to save developer time and ensure consistency across iOS and Android implementations. Keep in mind that most analytics tools cannot retroactively fix errors in historical data, so getting the setup right from the start is essential. With these integrations, you can fine-tune campaign targeting and improve your user acquisition strategies effectively.
Using Behavior Insights to Improve Campaigns
Improving Campaign Targeting
Behavior insights can sharpen your marketing strategies by helping you better understand and segment your audience. Start by analyzing in-app metrics to group users based on their interaction patterns. For instance, you might classify “power users” who log in daily separately from “casual users” who check in once a week.
Your analytics can also highlight which acquisition channels bring in the most engaged users. For example, you might find that users acquired through Facebook ads on iOS stick around longer compared to those from other platforms. A great case study is TicketSwap, which used Amplitude Audiences to dive into user behavior. By crafting targeted strategies to reduce unsold tickets, they achieved a 10% boost in total revenue.
Taking things a step further, personalize your targeting with metadata. Add layers like job role, company size, or industry to your behavioral data to deliver messages that feel tailor-made. Combine these insights with real-time triggers, such as personalized tooltips, to guide users at the exact moment they need help.
These refined approaches don’t just improve targeting – they also enhance the overall app experience, which leads us to the next key area.
Improving User Experience
Behavioral data can reveal where your app needs improvement. Focus on identifying your app’s “aha moment” – that key event where users realize its value – and remove any barriers that prevent them from getting there. For instance, Under Armour Connected Fitness noticed that low engagement with their race training plans was hurting retention. By redesigning the plans to offer a broader range of goals, they tripled feature usage among paid users and saw a significant retention lift.
Onboarding is another area where behavior insights can make a huge difference. With 71% of users expecting an app to load in under 3 seconds and 63% abandoning apps that take longer than 5 seconds, speed is critical. Tools like session replays can help you identify and fix bottlenecks in your onboarding process. Hookle, for example, used Smartlook recordings to pinpoint the causes of user-reported issues, saving 10 hours per week on bug reproduction and often resolving problems before support tickets were even filed.
Given that the average mobile session lasts only 2 to 3 minutes, it’s crucial to design experiences that let users accomplish meaningful actions quickly. Super.com leveraged behavioral data to identify which actions made users feel rewarded. By making targeted tweaks, they achieved a 90% increase in user retention. These improvements not only enhance the user experience but also provide a solid foundation for more precise campaign strategies.
Once you’ve made these improvements, the next step is to test and refine them continuously.
Setting Up a Test-and-Iterate Loop
To keep improving, you need a structured approach to testing. Document every event trigger and the business question it addresses. This ensures your team focuses on meaningful metrics and avoids getting bogged down by irrelevant data.
Cohort analysis is a powerful tool for measuring the impact of your changes. Compare users who joined after a specific update against earlier groups to see if retention rates have improved. For instance, if you revamp your app’s tutorial, track whether the new group reaches key milestones faster than the previous one.
A/B testing is another way to validate your ideas before rolling out changes across the board. Test variations of your app store listing, onboarding flow, or feature placements, and monitor how these tweaks influence key metrics. Assign team members to regularly review and update event definitions as your app evolves. This ensures your marketing decisions remain grounded in accurate, actionable data.
Conclusion
Understanding how users interact with your app is at the heart of any successful mobile strategy. But tracking in-app behavior isn’t just about gathering numbers – it’s a way to fuel real business growth. The reality is stark: nearly 90% of app users abandon an app within 30 days of downloading it. For small businesses, this makes creating meaningful, lasting engagement an uphill battle.
The good news? You don’t need a massive engineering team to get started. By mapping out your user journey, setting up key events, and blending hard data with tools like session replays, you can pinpoint where users are struggling and help them uncover your app’s value faster. The payoff is clear: data-driven decisions lead to 89% higher customer retention rates. It’s proof that relying on insights beats guesswork every time.
Platforms like AppInstitute make this process even easier for small businesses. Their no-code platform simplifies app creation with built-in analytics, push notifications, and user management tools. Whether you’re launching a brand-new app or improving an existing one, their drag-and-drop editor and pre-designed templates let you focus on what matters most: understanding and connecting with your users.
Start by tracking the events that align with your goals, then adjust as you learn more. This intentional approach doesn’t just improve your app – it strengthens your ability to engage customers and fine-tune your marketing efforts.
FAQs
What are the most important metrics to track for app user engagement?
Tracking key metrics gives you a clear picture of how users interact with your app and highlights areas that need attention. Here are some key engagement metrics to keep an eye on:
- Daily Active Users (DAU): This measures the number of unique users engaging with your app daily, offering a snapshot of consistent usage.
- Churn Rate: This tells you the percentage of users who stop using your app within a specific timeframe, shedding light on retention challenges.
- Push Notification Opt-In Rate: This shows the percentage of users who agree to receive push notifications, indicating their interest in staying updated and engaged.
- Average Session Length: This tracks the average time users spend in your app during a session, revealing insights into how engaging and user-friendly your app is.
By keeping tabs on these metrics, you can gain valuable insights into user behavior, refine your strategies to retain users, and boost your app’s overall performance.
How can I use in-app behavior data to improve user retention?
Understanding how users interact with your app – through data like screen views, feature usage, session length, and crash reports – can reveal why they stick around or decide to leave. Start by identifying key retention metrics like day-7 retention rates or churn rates, and connect them to specific user behaviors. This can help you pinpoint where users might be running into issues. For instance, long load times or confusing navigation could lead to higher drop-off rates.
After spotting these problem areas, take action. Begin by segmenting your users – for example, compare those who complete onboarding with those who don’t. Then, test solutions like speeding up load times or simplifying essential workflows. A/B testing can help you measure the effectiveness of these changes so you can fine-tune your approach. To take it a step further, personalize the experience by sending targeted in-app messages or push notifications. These can encourage users to return and explore features that add real value.
Platforms like AppInstitute’s no-code solution make this process easier. They let you track user behavior, monitor performance metrics, and implement changes – all without needing coding skills. By consistently analyzing and acting on user insights, you can create stronger connections with your users and keep them coming back.
What are the best tools to track user behavior in a mobile app?
Tracking how users interact with your app doesn’t have to be complicated – especially if you’re using the right tools. Platforms like Google Analytics for Firebase offer a straightforward way to gain real-time insights into user activity. You can easily track events, session data, and more, all without diving into complex coding. If you’re looking for something with more advanced capabilities, Amplitude delivers detailed behavioral analytics, such as custom event tracking and funnel analysis, all through an easy-to-navigate dashboard. For a more visual approach, Smartlook lets you monitor user interactions through session recordings and heatmaps, helping you spot trends and refine user flows.
When it comes to performance monitoring, tools like Android Profiler, New Relic, and UXCam are invaluable. These tools let you keep tabs on key metrics like load times, frame rates, and crash reports, ensuring your app performs smoothly. By integrating these tools into an app built with AppInstitute, you can immediately start collecting actionable data – whether it’s user engagement, conversion rates, or performance stats. This data empowers you to make smarter decisions that enhance user retention and drive revenue.
Related Blog Posts
- How to Automate User Onboarding in Apps
- Best Practices for User Activity Tracking in Apps
- Retention Metrics for PWAs: Ultimate Guide
- Ultimate Guide to Mobile App Analytics 2025
Last Updated on January 23, 2026 by Becky Halls
0 thoughts on “How to Track In-App User Behavior”