
Mobile app analytics helps you understand how users interact with your app and how it performs. This data is essential for improving retention, engagement, and revenue. By tracking user actions and analyzing metrics like retention rates, session length, and revenue per user, you can identify issues and make data-driven improvements.
“The biggest breakthroughs in app growth rarely come from new features – they come from understanding user behaviour. Analytics turns guesswork into strategy.” Ian Naylor, Founder of AppInstitute
Key takeaways:
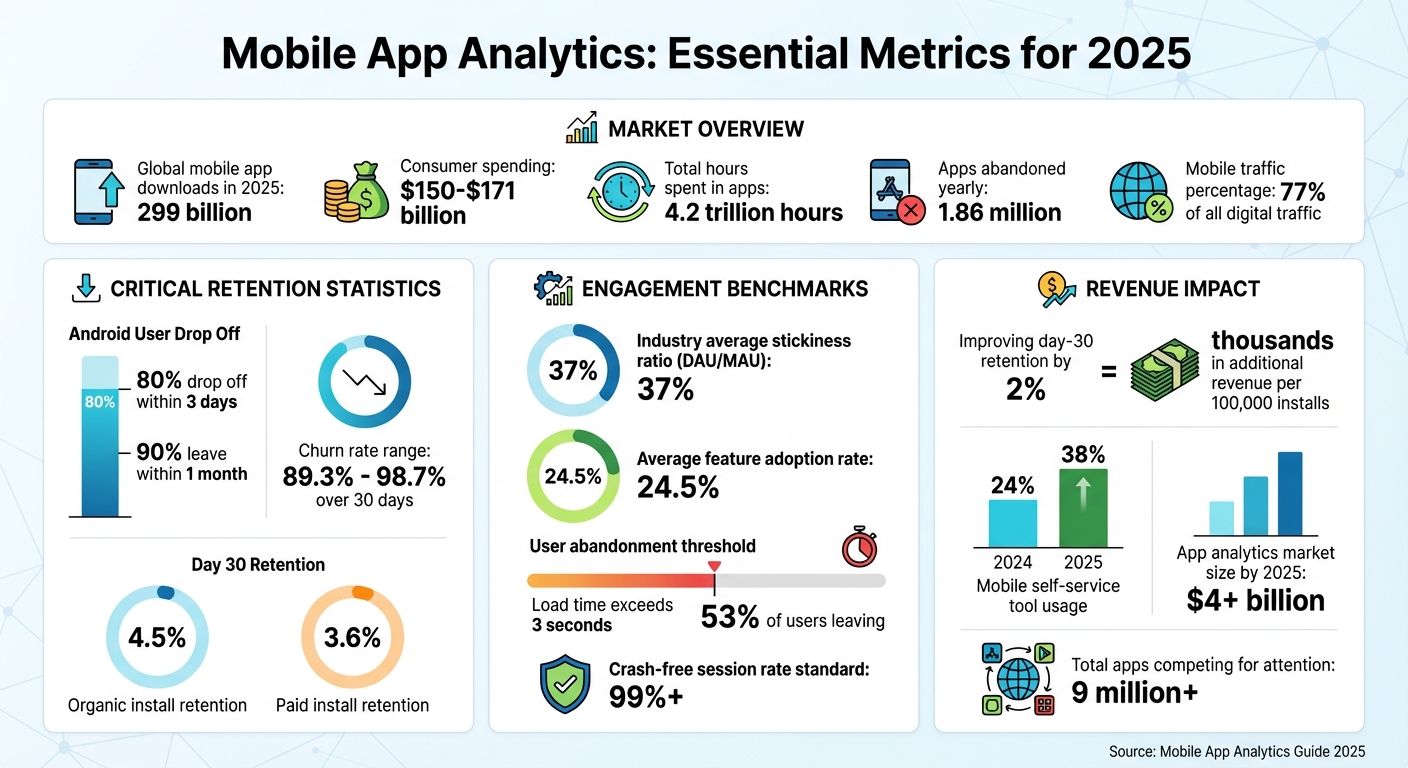
- Retention matters: 80% of Android users drop off within 3 days, and 90% leave within a month.
- Revenue insights: Improving day-30 retention by just 2% can add thousands in revenue for 100,000 installs.
- Privacy changes: Tools now focus on aggregated data due to stricter privacy rules like Apple’s ATT.
- Top tools: Firebase, Amplitude, and Mixpanel offer free tiers and advanced analytics features.
To succeed, focus on tracking the right metrics, setting up actionable dashboards, and using analytics tools to guide your decisions. For small businesses, platforms like Firebase provide free, easy-to-use solutions for understanding user behavior and improving app performance.
Mobile App Analytics Key Metrics and Statistics 2025
The 7 best mobile analytics tools to use in 2025

Key Metrics to Track in Mobile App Analytics
Tracking the right performance metrics is essential for mobile app success in 2025. With global mobile app downloads projected to hit 299 billion that year, standing out in this crowded space requires understanding how users find, engage with, and spend on your app. The right data can uncover where users come from, whether they stay, and how they contribute to revenue.
“Most apps fail because teams measure too much… and learn too little. If a metric doesn’t influence onboarding, retention, or revenue, then it’s not worth looking at.” Becky Halls, SEO Strategist
User Acquisition Metrics
Downloads are a starting point – they show initial interest. But to understand the cost of attracting users, focus on Cost Per Install (CPI) and Customer Acquisition Cost (CAC). CPI measures the cost of each download, while CAC looks at the expense of acquiring an engaged user.
Tracking the split between organic and non-organic installs gives insight into how users discover your app. Organic installs – users who find your app naturally – tend to retain better, with a 4.5% retention rate at day 30 compared to 3.6% for paid installs. Metrics tied to App Store Optimization (ASO), like rankings, keyword performance, and user ratings, play a big role in organic discovery.
“Peer recommendations in the form of app store ratings and reviews stand alone as the single greatest driver of discovery and conversion.” – Alchemer
Another key metric is Click-to-Install (CTI), which measures how many users who click on an ad go on to install the app. Attribution data helps pinpoint which channels – whether Instagram ads, Google search, or another platform – are most effective, so you can allocate your budget wisely.
Once you’ve identified how users find your app, the next step is to analyze their engagement and retention.
Engagement and Retention Metrics
Metrics like Daily Active Users (DAU) and Monthly Active Users (MAU) track ongoing app usage. The stickiness ratio (DAU divided by MAU) shows whether your app is becoming a daily habit. A stickiness ratio of 37% is the industry average, meaning if you have 1,000 monthly users, about 370 are active daily.
Session length reveals how much time users spend in each visit, while session interval tracks how frequently they return. But longer sessions don’t always mean better engagement. As product leader Aakash Gupta points out:
“When a 5-minute task takes 45 minutes, it’s not engagement – it’s frustration.” – Aakash Gupta, Product Leader
Retention rate measures the percentage of users who return after their first visit, while churn rate shows how quickly users leave – often falling between 89.3% and 98.7% over 30 days. Understanding feature adoption is also critical; it reveals which app features users value most. On average, only 24.5% of users adopt core features. High exit rates on certain screens can signal areas where users are encountering friction.
While engagement metrics are vital, understanding revenue-related data is just as important for your app’s monetization strategy.
Revenue and Conversion Metrics
Revenue metrics like Average Revenue Per User (ARPU) and Average Revenue Per Paying User (ARPPU) offer a baseline for understanding user value. Lifetime Value (LTV) estimates the total revenue a user generates over time, while metrics like conversion rate, Average Order Value (AOV), and Time to First Purchase provide insights into monetization efficiency.
Comparing LTV with CAC is essential to ensure your acquisition costs are justified. Conversion rate highlights the percentage of users completing monetized actions, such as subscriptions or in-app purchases. For e-commerce apps, AOV shows how much users spend per transaction, while Time to First Purchase tracks how quickly users transition into paying customers.
Finally, Return on Investment (ROI) evaluates how your revenue stacks up against development and marketing expenses, giving a complete picture of performance. With mobile traffic now making up 77% of all digital traffic, and 38% of consumers using mobile self-service tools daily in 2025 (up from 24% in 2024), the potential for growth is immense.
Top Mobile App Analytics Tools for 2025
The global app analytics market is set to exceed $4 billion by 2025. With over 9 million apps vying for consumer attention worldwide, and mobile users spending a staggering 4.2 trillion hours in apps and approximately $150 billion, choosing the right analytics tool is critical. The right tool can help you understand your audience deeply – without it, you’re essentially navigating in the dark.
Feature Comparison of Popular Tools
Each analytics platform brings something unique to the table. Firebase Analytics is a favorite for small businesses, thanks to its free tier and seamless integration with Google services like Google Ads. On the other hand, Amplitude shines with its behavioral analytics, offering advanced cohort analysis to monitor user journeys and retention patterns. Mixpanel takes an event-based tracking approach, providing detailed funnel analyses and machine learning-driven predictions [17, 18].
We’ve seen apps double their retention by fixing a single step in the onboarding funnel. One drop-off point can cost you thousands of users!
Emerging tools are also tackling the challenges of 2025. Segwise, for example, uses AI to connect ad creative elements – like visuals, text, and audio – with ROAS (Return on Ad Spend) and retention metrics. UXCam focuses on visual context, offering session replays and heatmaps to identify user pain points. For businesses running paid ad campaigns, Adjust provides solutions for attribution and fraud prevention [17, 18].
| Tool | Primary Strength | Platform Support | Starting Price |
|---|---|---|---|
| Firebase | Ecosystem Integration | iOS, Android, PWA | Free |
| Amplitude | Behavioral Insights | iOS, Android, Web | Free (10M actions/month) |
| Mixpanel | Funnel & Retention | iOS, Android, Web | Free tier available |
| Segwise | Creative ROAS Mapping | iOS, Android | Free trial |
| UXCam | Visual Session Replay | iOS, Android | Free (3,000 sessions/month) |
| Adjust | Attribution & Fraud | iOS, Android | Custom pricing |
This table offers a snapshot to help small businesses identify tools that align with their goals and budgets.
Recommended Tools for Small Businesses
Based on the feature comparison, here are some top recommendations for small businesses:
Firebase Analytics is an excellent choice for those on a tight budget. Its free tier includes event tracking, crash reporting, and the infrastructure needed to build and analyze your app. As Poppins Labs notes, “Firebase Analytics is a great choice for small businesses because it’s free and integrates seamlessly with other Google services”. This makes it a solid starting point for businesses looking to improve app engagement and customer retention.
For teams prioritizing product-led growth, Amplitude is a standout option. Its free tier supports up to 10 million user actions per month. In 2025, Instacart leveraged Amplitude to track user behavior across platforms. By analyzing behavior cohorts and optimizing their landing page and sign-up flows, they boosted first-time grocery order conversions by 10%. This kind of actionable insight is invaluable for enhancing customer engagement and retention.
Mixpanel offers robust funnel analysis and simple scalability, making it a strong contender for businesses seeking straightforward implementation. For no-code app builders, tools like UXCam and Statsig simplify tracking with autocapture features, eliminating the need for manual tagging [21, 24, 25]. Meanwhile, Segwise stands out for its ability to link creative ad elements to performance metrics.
“The core problem you face is not whether to track behavior; it’s which mobile app analytics tool will reliably link creative, spend, and value under today’s measurement limits”, says Shobhit Gupta of Segwise.
sbb-itb-539ae66
Integrating Analytics with No-Code Platforms like AppInstitute
Benefits of Analytics for No-Code Apps
Small businesses often pour resources into attracting users but struggle to understand why some leave. Analytics bridge this gap by pinpointing where users lose interest and what keeps them coming back. For no-code app creators using AppInstitute, this means they can easily find and fix pain points in the user experience.
Analytics also help identify which marketing channels bring in the most engaged users, allowing businesses to focus their budgets on strategies that actually convert. For example, restaurants and salons using AppInstitute’s tailored templates can track crucial metrics like loyalty program sign-ups, in-app bookings, or store visits. These insights lead to smart, data-driven decisions that boost user engagement and revenue.
Performance metrics, such as crash rates and load times, are another critical piece of the puzzle. With 53% of users abandoning apps that take more than three seconds to load, maintaining fast performance is non-negotiable. AppInstitute’s drag-and-drop modules, combined with analytics data, make it easy to refine features based on how users actually interact with the app.
How to Integrate Analytics with AppInstitute
To unlock these insights, you can integrate Firebase Analytics with your AppInstitute app. Through AppInstitute’s settings dashboard, you can connect to third-party analytics tools like Google Analytics for Firebase. Firebase is a popular choice for no-code app builders because it’s free, supports up to 500 unique events, and works seamlessly with Google Ads for tracking campaigns across multiple ad networks.
Here’s how to get started: set up a Google Analytics property, create an app data stream for your iOS or Android app, and add the Firebase tracking ID directly into the AppInstitute dashboard. For more tailored tracking, you can embed custom scripts using AppInstitute’s HTML or Frame Web Content features. Once configured, you can verify your setup in real time with Firebase’s DebugView tool.
AppInstitute also provides 24/7 online chat support and free one-on-one consultations. This guidance makes advanced analytics approachable, even for small businesses with no prior experience. If you’re just starting out, take advantage of their 30-day free trial to build your app and fine-tune your analytics setup before committing to a paid plan, which starts at $39/month.
Best Practices for Using Mobile App Analytics
Setting Up Dashboards and Reports
Start by defining 12–20 key events that represent critical user actions, like sign_up, add_to_cart, or purchase. Avoid tracking every possible event – it can clutter your data and make it harder to focus on what matters. Stick to a consistent naming format, such as “Object_Action” (e.g., Playlist_Created or Checkout_Completed), to ensure clarity across teams.
Your dashboard should center around three essential views:
- Funnels: Show where users drop off during key processes.
- Paths: Reveal how users navigate through your app.
- Cohorts: Track retention over time to see if it improves.
Don’t overlook technical health metrics like crash-free sessions and cold-start times, as these are critical for user satisfaction. Remember, 53% of users abandon apps that take longer than three seconds to load. Identify your app’s “Aha!” moment – the action that delivers the most value to users – and use it as your guiding metric.
| Dashboard Component | Key Metrics to Include | Purpose |
|---|---|---|
| Technical Quality | Crash-free rate, Cold-start time, API errors | Ensure the app is stable and reliable |
| Acquisition | CAC, Installs-to-Opens, Attribution source | Assess marketing effectiveness and ROI |
| Engagement | DAU/MAU ratio, Session duration, Feature adoption | Measure how often and how deeply users interact with your app |
| Retention | Day-1, Day-7, and Day-30 Cohorts | Evaluate whether users find long-term value |
| Monetization | ARPU, LTV, Conversion rate | Track revenue and profitability |
Once your dashboard is set up, dive deeper into user behavior to address retention challenges and improve the overall experience.
Analyzing User Behavior and Retention
Use your dashboard data to uncover patterns in user behavior and retention. On average, Android apps lose 80% of their daily active users within the first three days and 90% within the first month. Group users by actions they’ve completed to identify what drives retention. These behavioral patterns provide valuable context to the metrics you’re tracking.
Combine quantitative data with qualitative tools like session replays and user surveys. Watching session replays of crashes can reveal what users were doing right before the app failed, helping you fix issues faster. Map out the “happy path” – the key steps a user takes to reach your app’s core value – and monitor these steps as a conversion funnel.
Technical performance also plays a big role in engagement. A crash-free session rate above 99% is considered the industry standard, and high crash rates are a direct cause of user churn. For Android apps, keep a close eye on cold-start times and “App Not Responding” (ANR) errors, as these impact your app’s ranking on the Play Store.
“Most people use analytics the way a drunk uses a lamppost – for support rather than illumination”.
Using Data for Continuous Improvement
Once you’ve analyzed user behavior, use those insights to make meaningful changes. Follow a structured process: set goals, gather data, turn it into insights, define KPIs, develop strategies, test and iterate. This ongoing cycle builds on the foundation of your analytics framework. Funnel analysis can pinpoint where the largest drop-offs occur – whether during checkout or sign-up – so you can prioritize fixing those areas.
Compare user paths to see how users who convert differ from those who don’t. For every A/B test, write a clear hypothesis, such as: “Shortening the sign-up process will increase day-7 retention by 2 percentage points”. Redesigning landing pages and leveraging behavior cohorts can boost conversion rates by as much as 10%.
Focus on “Time to First Value” to remove hurdles in your onboarding process. Avoid relying on a single North Star metric, as it may not provide the full picture. Instead, track 3 to 5 primary metrics that align with your business goals.
“You can’t manage what you can’t measure”.
Conclusion
Mobile app analytics turns guesswork into informed decisions. By 2025, consumers are expected to spend between $150 billion and $171 billion on mobile apps, logging an astounding 4.2 trillion hours globally. At the same time, around 1.86 million apps are abandoned each year – staggering numbers that highlight the importance of understanding user behavior.
“When we analyse struggling apps, the problem is almost never traffic — it’s activation. Analytics is what turns an install into a habit.” Ian Naylor, Founder at AppInstitute
To make a real impact, focus on metrics that matter: stickiness (DAU/MAU), retention cohorts, and Customer Lifetime Value. Technical performance plays a huge role in keeping users engaged. For example, a crash-free rate below 99.5% or slow load times can quickly drive users away.
Start small with a manageable plan: focus on a single user flow, like onboarding. Define 12 to 20 critical events, and implement one targeted change to address your biggest drop-off point. Pinpoint your app’s “Aha!” moment – the key action that reveals its core value – and design your analytics strategy to guide users to that moment as quickly as possible. This focused approach lays the groundwork for turning insights into measurable improvements.
“The goal is to turn data into information, and information into insight”.
Once you’ve identified the right metrics, use modern analytics tools to turn raw data into actionable changes. Frameworks like SKAdNetwork 4.0 and Android’s Privacy Sandbox offer precise measurement while respecting user privacy. Whether you’re using Firebase’s free tier or building a custom analytics stack, the priority is connecting insights to action. Use dashboards to spot trends, session replays to understand user behavior, and A/B testing to validate solutions.
“Great analytics isn’t just about dashboards — it’s about asking the right questions before writing a single line of code.” Ian Naylor, Founder at AppInstitute
For no-code platforms like AppInstitute, integrating analytics can be seamless – many tools offer SDKs that don’t require engineering support. The real challenge isn’t technical – it’s adopting a data-focused mindset. As this guide has emphasized, turning data into action is critical. Treat every product update as an experiment and test your hypotheses. With Android’s rapid early churn rates, every hour without analytics is lost revenue. By committing to these strategies, small businesses can maximize engagement and revenue from every app interaction.
FAQs
How do Apple’s privacy rules, like AppTrackingTransparency (ATT), impact mobile app analytics?
Apple’s AppTrackingTransparency (ATT) framework has introduced a significant change: iOS users now need to explicitly opt in before their data can be linked to advertising identifiers. Unsurprisingly, many users decline, which limits the ability to gather detailed insights. Instead, marketers and analysts must turn to Apple’s SKAdNetwork. While this tool offers aggregated attribution data, it falls short when it comes to the detailed tracking, segmentation, and optimization that many businesses rely on.
This new landscape has pushed companies to rethink their approach. Privacy-friendly analytics strategies have taken center stage, encouraging businesses to find creative, respectful ways to understand user behavior without compromising their preferences.
What key metrics should I track to improve app retention?
To keep users coming back to your app, it’s crucial to track a few key metrics that reveal how they interact with it:
- Retention Rate: This tells you how many users return to your app within a specific time frame. It’s a straightforward way to gauge loyalty.
- Churn Rate: This metric highlights the percentage of users who stop using your app, giving insight into where you might be losing them.
- Daily and Monthly Active Users (DAU/MAU): These numbers show how engaged your audience is on a daily and monthly basis, helping you spot patterns in usage.
- Average Session Length: By measuring how much time users spend per session, you can understand whether they find your app engaging enough to stick around.
- Stickiness Ratio: Calculated by dividing DAU by MAU, this metric reveals how frequently users interact with your app, offering a snapshot of overall engagement.
Keeping an eye on these metrics can help you spot trends, better understand user behavior, and fine-tune your strategies to boost retention.
What are the best mobile app analytics tools for small businesses?
For small businesses, picking the right mobile app analytics tools can make all the difference when it comes to understanding user behavior, increasing engagement, and driving growth. Here are some top options to consider for 2025:
- Firebase Analytics: This free tool from Google provides real-time insights and integrates effortlessly with both iOS and Android apps.
- Mixpanel: Focused on event-based tracking, Mixpanel helps businesses monitor custom user actions and gain practical insights – all without needing advanced technical skills.
- Amplitude: Perfect for businesses prioritizing user retention, Amplitude offers detailed cohort analysis and reports designed to improve engagement.
What makes these tools stand out for small businesses? They’re affordable, simple to set up, and deliver straightforward data that’s easy for anyone to interpret. By using these platforms, small business owners can make smarter decisions and enhance their app’s performance without a hefty budget.
Related Blog Posts
- Top 7 No-Code Trends for Cross-Platform Apps 2025
- How to Automate User Onboarding in Apps
- Best Practices for User Activity Tracking in Apps
- Retention Metrics for PWAs: Ultimate Guide
Last Updated on January 6, 2026 by Becky Halls
0 thoughts on “Ultimate Guide to Mobile App Analytics 2025”